
Repost license
Request authorization before reposting and retain the authorization code, original URL, and go/affiliate links.
Original URL:https://www.geekcorelab.com/post/record-a-visualization-of-resource-utilization-using
The commercial link is an authorized go short link that must stay on the reposted page. It records the source before sending readers to the original article.
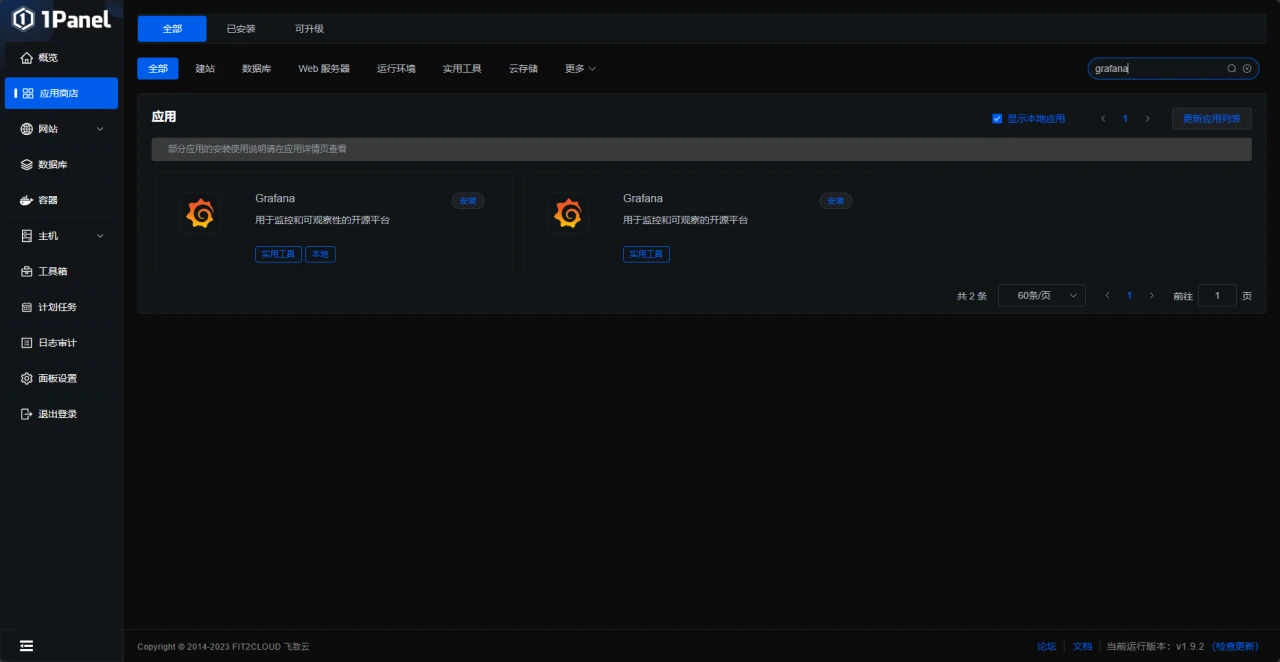
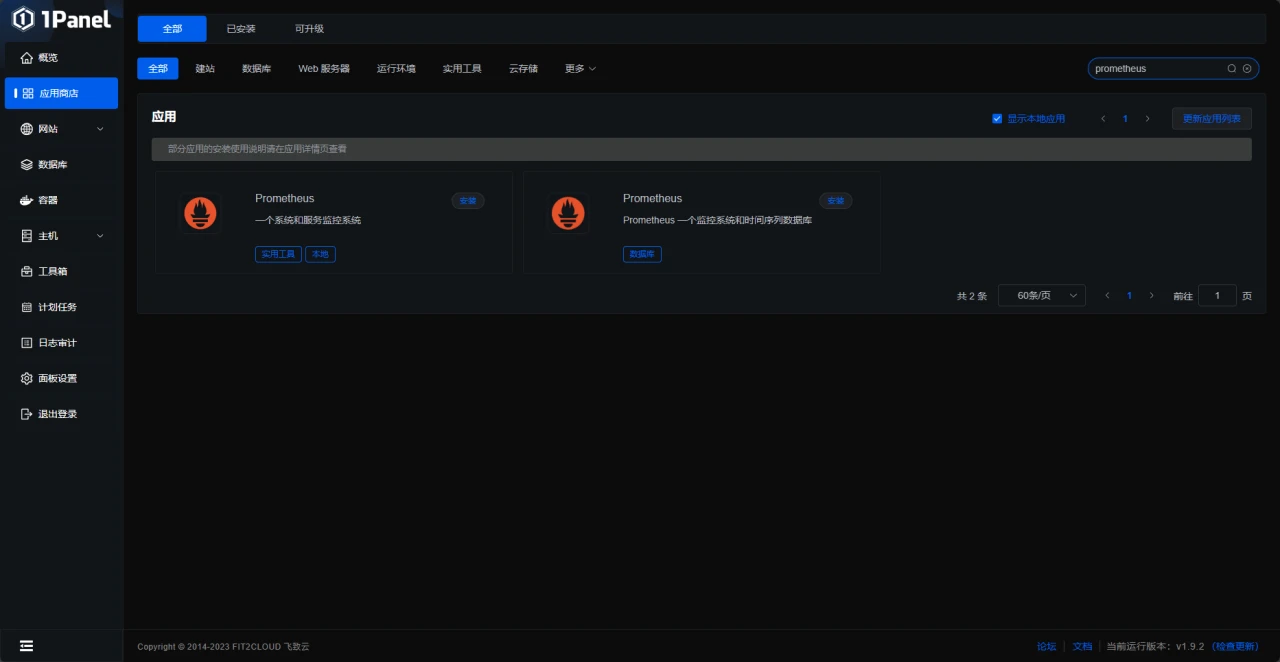
If you use 1Panel, both Grafana and Prometheus have one-click versions in 1Panel, but the method of using the 1Panel apps has not been tested
If you want to use 1Panel, you can choose pre-installation when purchasing a server
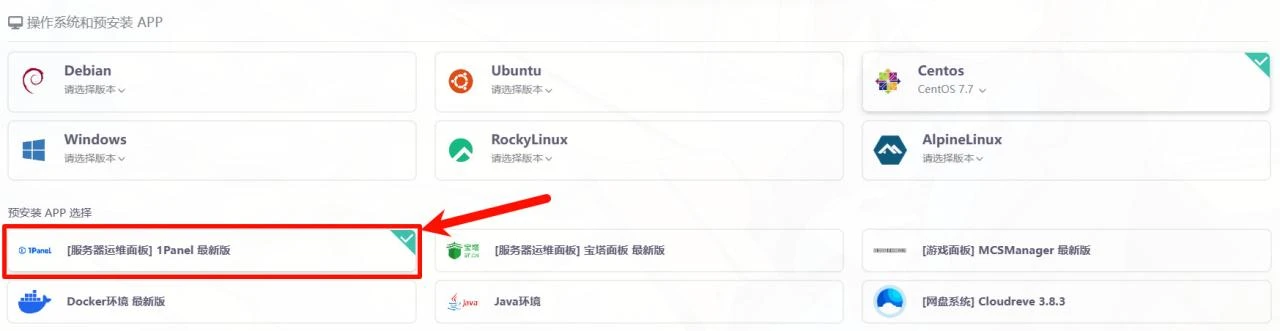
The image above is a pre-installation example from Rainyun; some providers may not support pre-installation, see Online Installation - 1Panel Documentation
This article uses a home cloud + centos for demonstration
Preparations
First prepare the software environment
-
- node_exporter
-
- prometheus
-
- grafana
These are essential
Installation
First we install node_exporter
The purpose of node_exporter is to collect machine system data.
Download the package from the official website
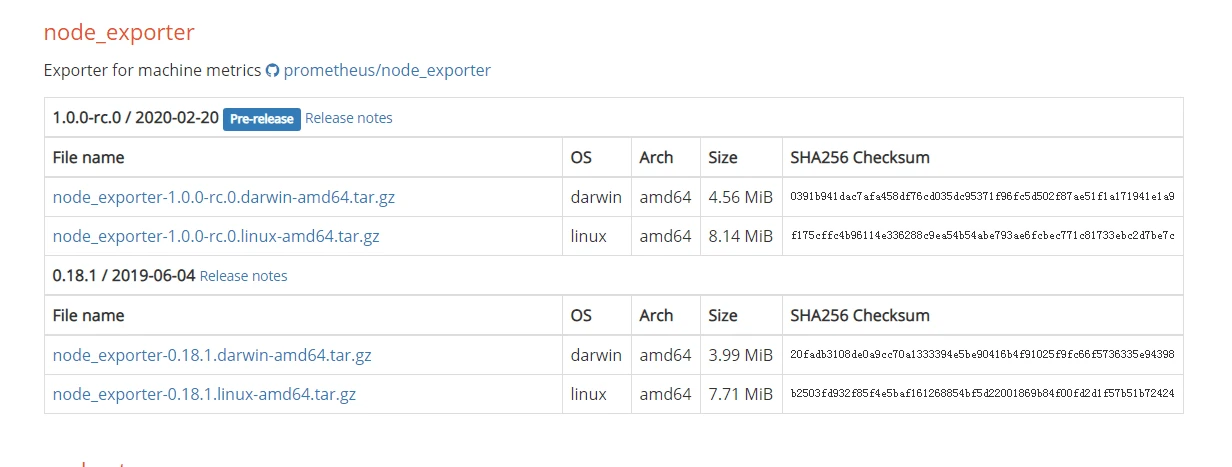
Download and install using Linux commands
wget https://github.com/prometheus/node_exporter/releases/download/v1.0.0-rc.0/node_exporter-1.0.0-rc.0.linux-amd64.tar.gz #下载node_exporter包
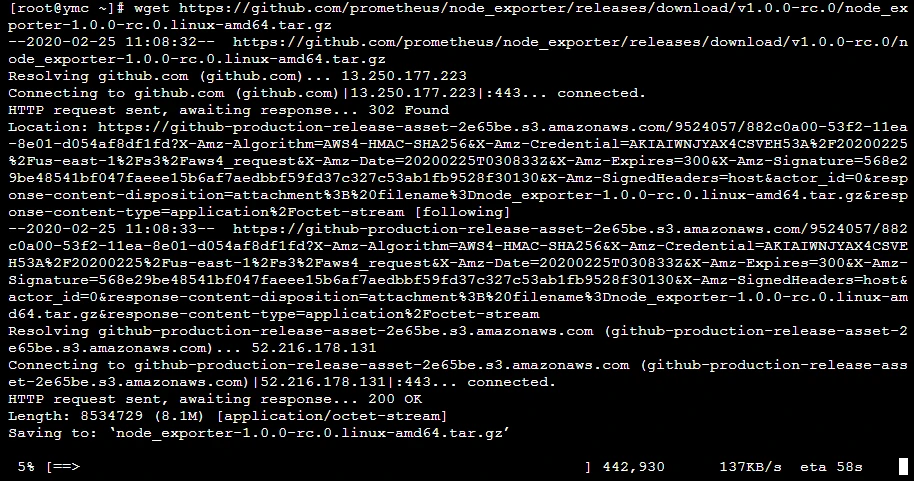
tar xvf node_exporter-1.0.0-rc.0.linux-amd64.tar.gz #解压下载来的包

mv node_exporter-1.0.0-rc.0.linux-amd64 node_exporter #把解压的目录改成node_exporter

cd node_exporter #进入node_exporter目录

./node_exporter #运行node_exporter
If you see this image, the code has been installed and run successfully
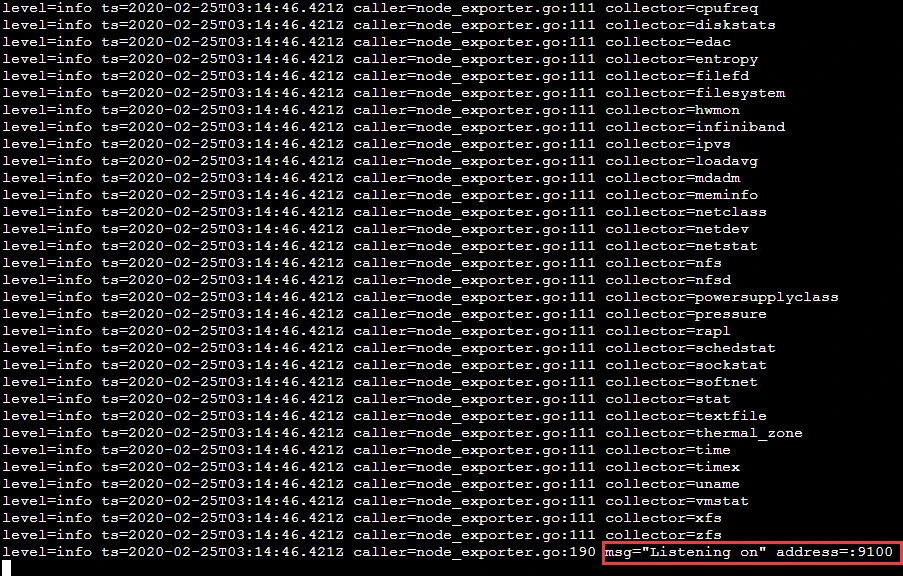
Visit http://localhost:9100/metrics
Next, install prometheus
Prometheus is a general term for a class of data collection components. It is responsible for collecting data from targets and converting it into the format supported by Prometheus.
Download the package from the official website
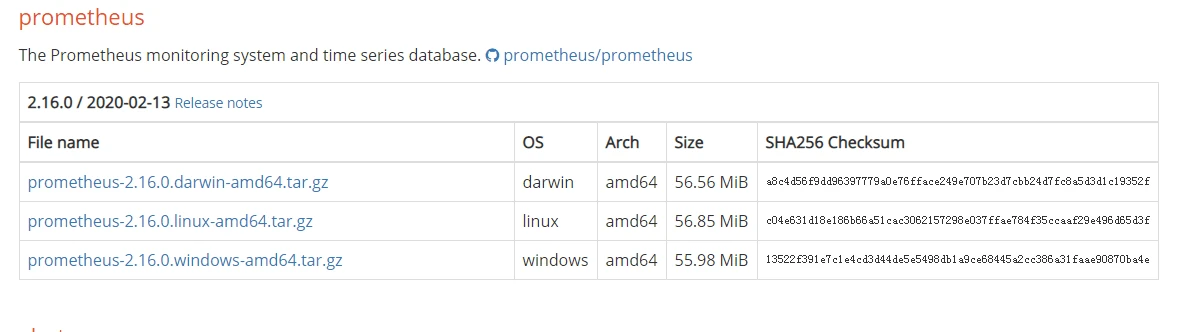
Download and install using Linux commands
wget https://github.com/prometheus/prometheus/releases/download/v2.16.0/prometheus-2.16.0.linux-amd64.tar.gz
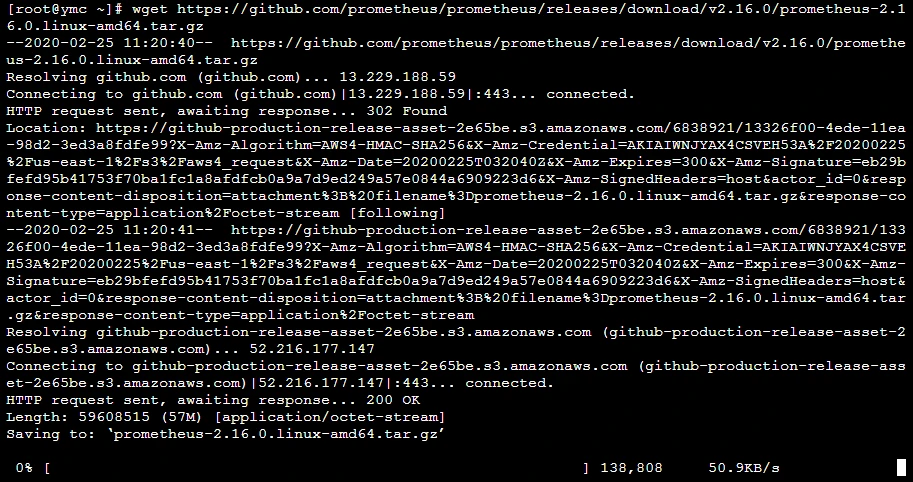
tar xvf prometheus-2.16.0.linux-amd64.tar.gz #解压下载来的包

mv prometheus-2.16.0.linux-amd64.tar.gz prometheus#把解压的目录改成prometheus

cd prometheus #进入prometheus目录
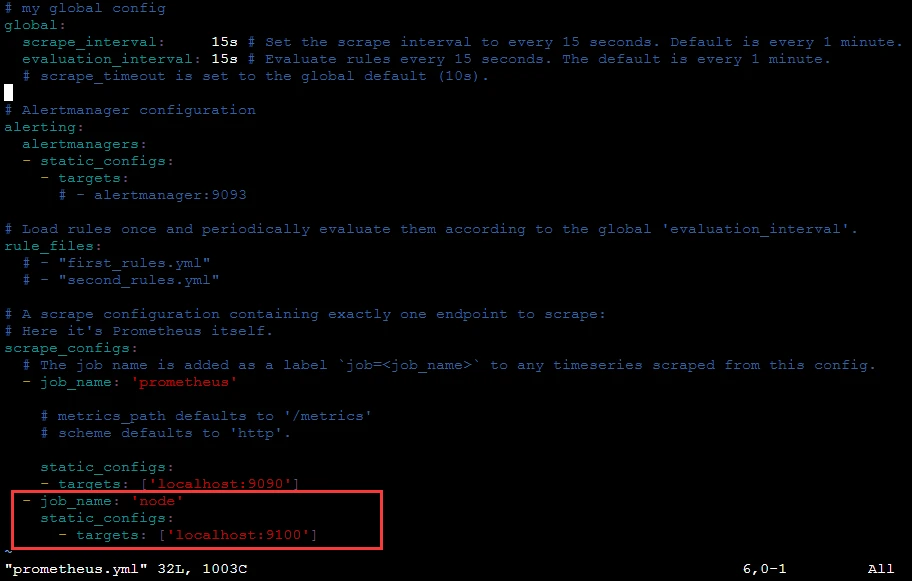
Here we need to pay attention to modifying the prometheus configuration file

Use vim to add the following under scrape_configs in the prometheus.yml file
 - job_name: 'node'
    static_configs:
      - targets: ['localhost:9100']
Here we listen to the data from node_exporter
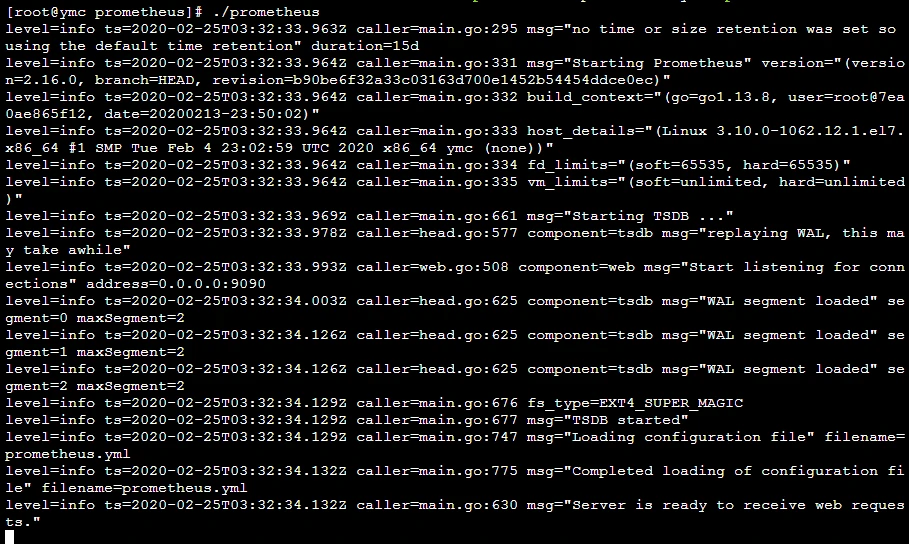
Finally we start the prometheus service
./prometheus #启动prometheus服务
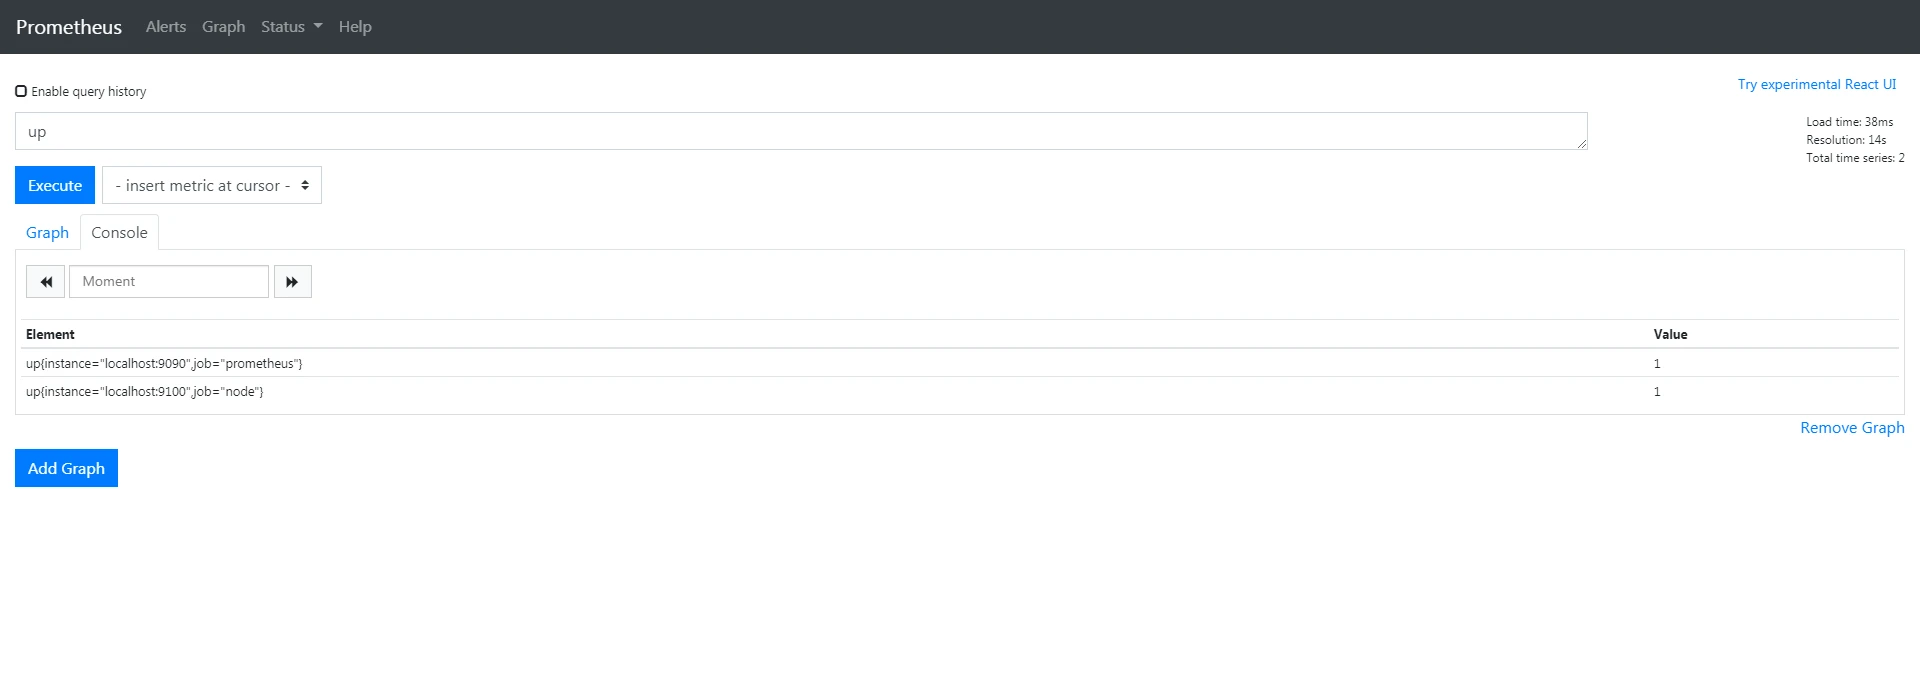
Visit http://47.103.87.205:9090/graph
Search for up; if the following image appears, it means it is running successfully and data is being monitored
If
up{instance="localhost:9090",job="prometheus"}    0
up{instance="localhost:9100",job="node"}    0
it means no data is being monitored
Finally we install grafana
wget https://dl.grafana.com/oss/release/grafana-6.6.2-1.x86_64.rpm
sudo yum localinstall grafana-6.6.2-1.x86_64.rpm
For other servers, see the official website
Address https://grafana.com/grafana/download?platform=linux
sudo systemctl start grafana-server #启动grafana
Visit http://localhost:3000/login
The default account and password are admin

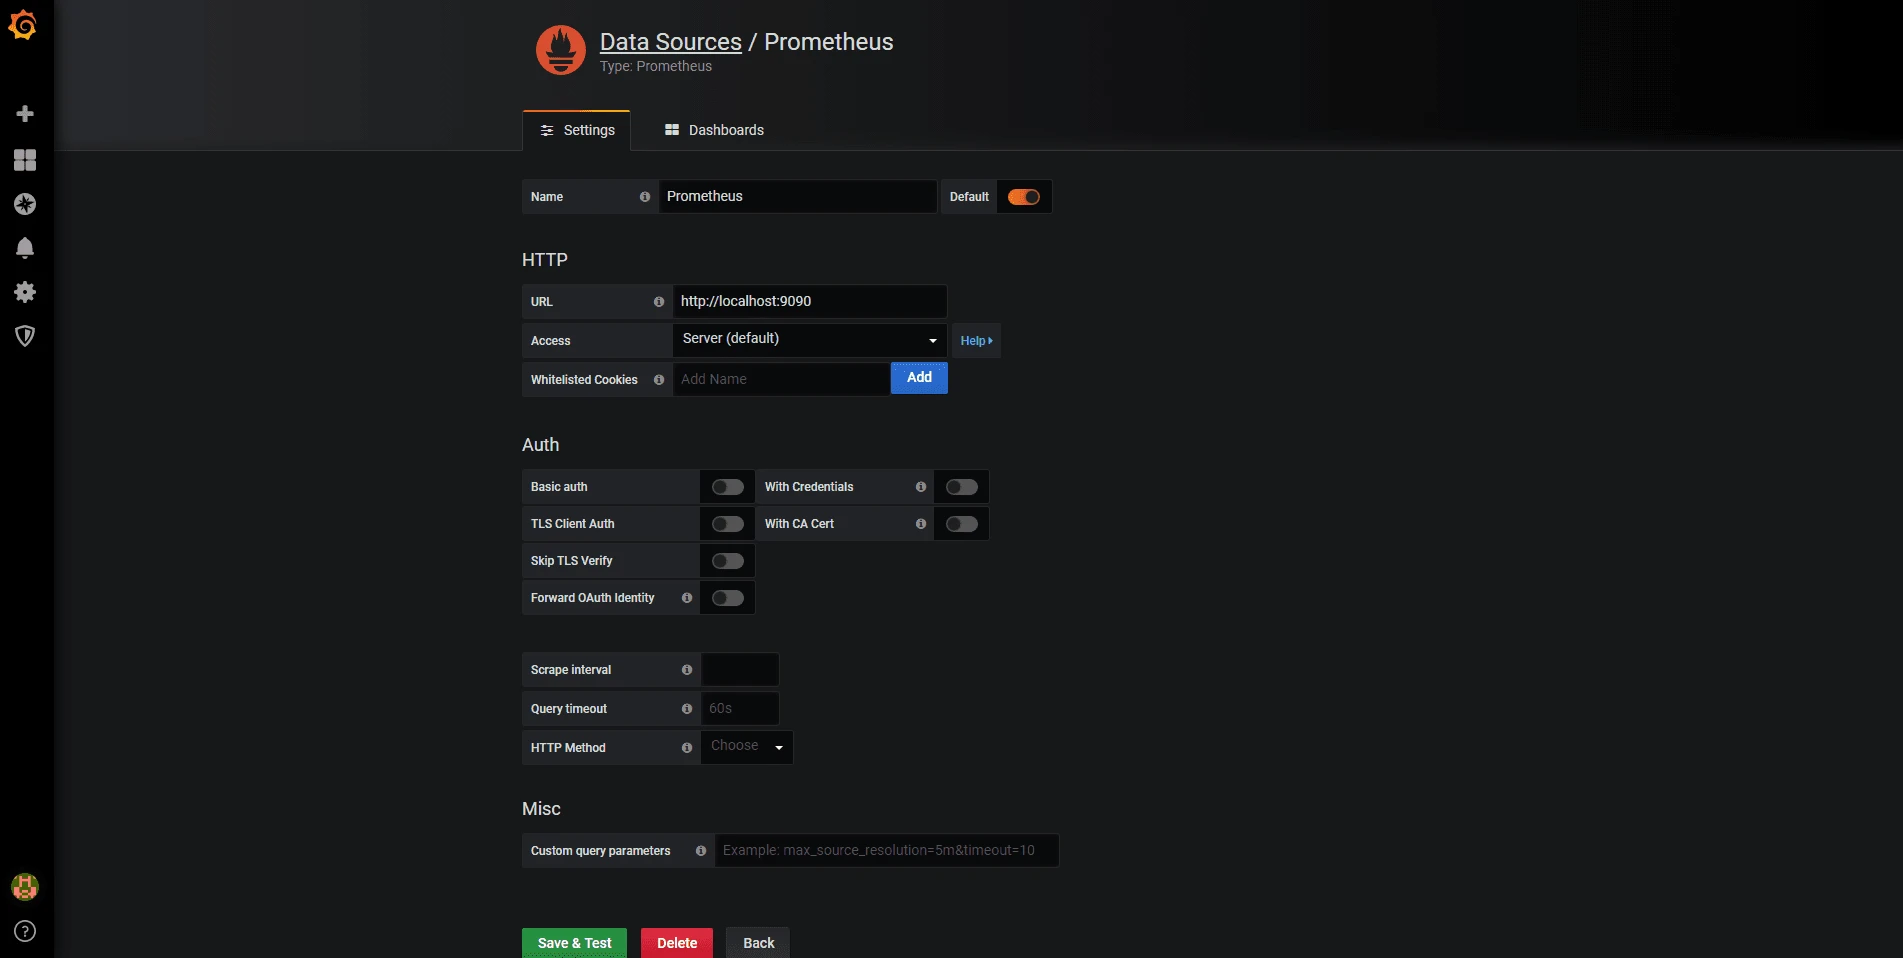
Add the prometheus data source
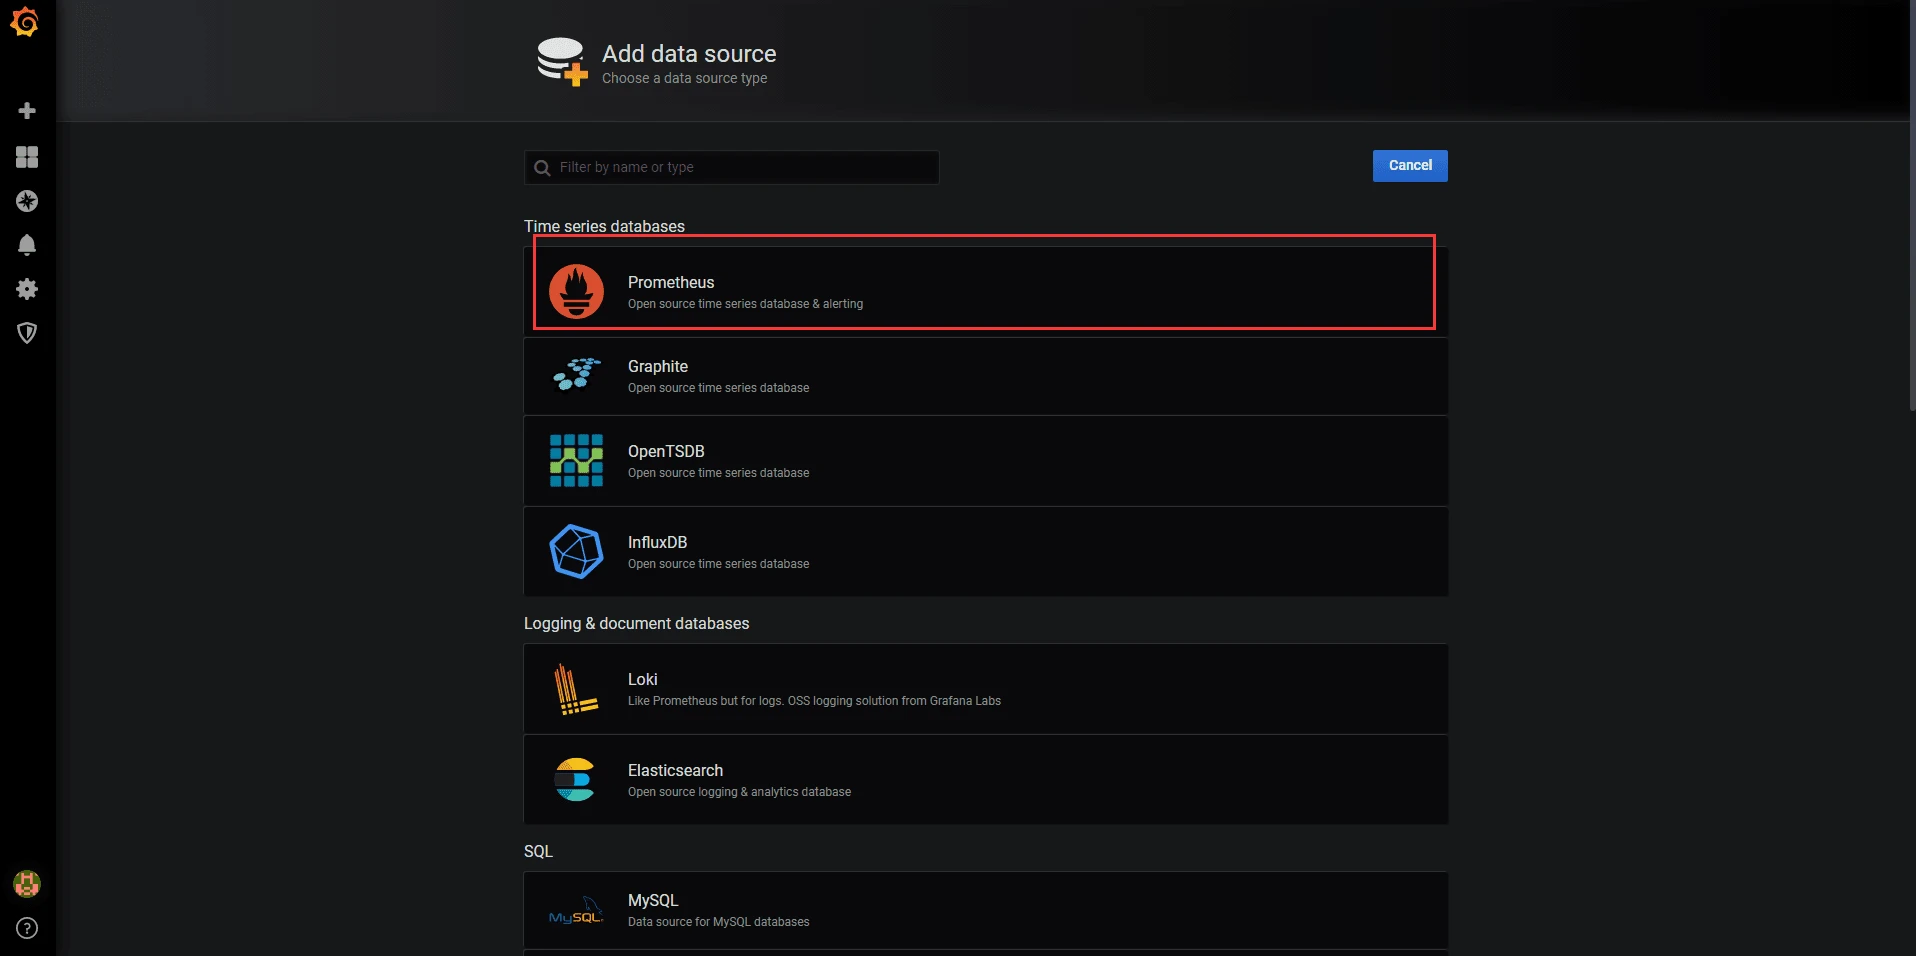
Add Dashboards
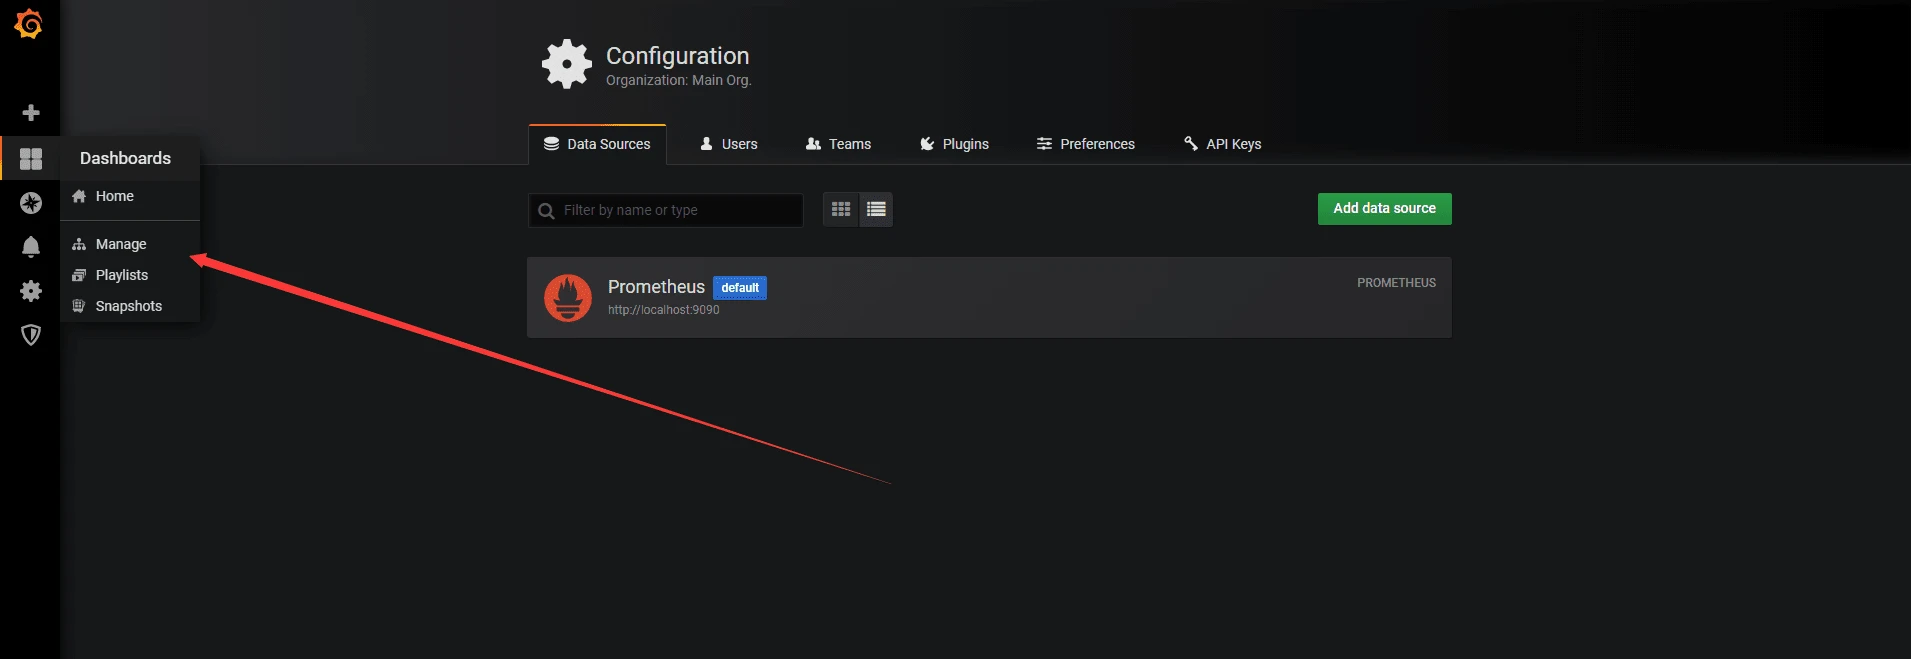
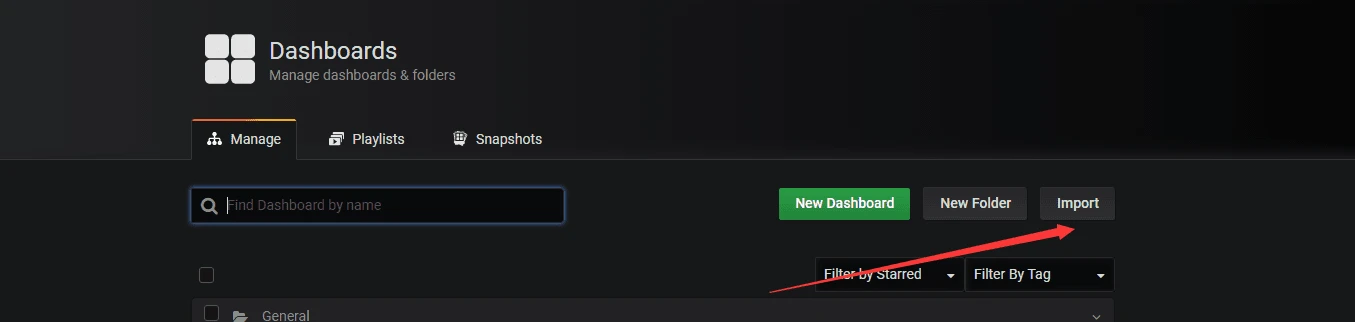
Here we click Import to import Dashboards
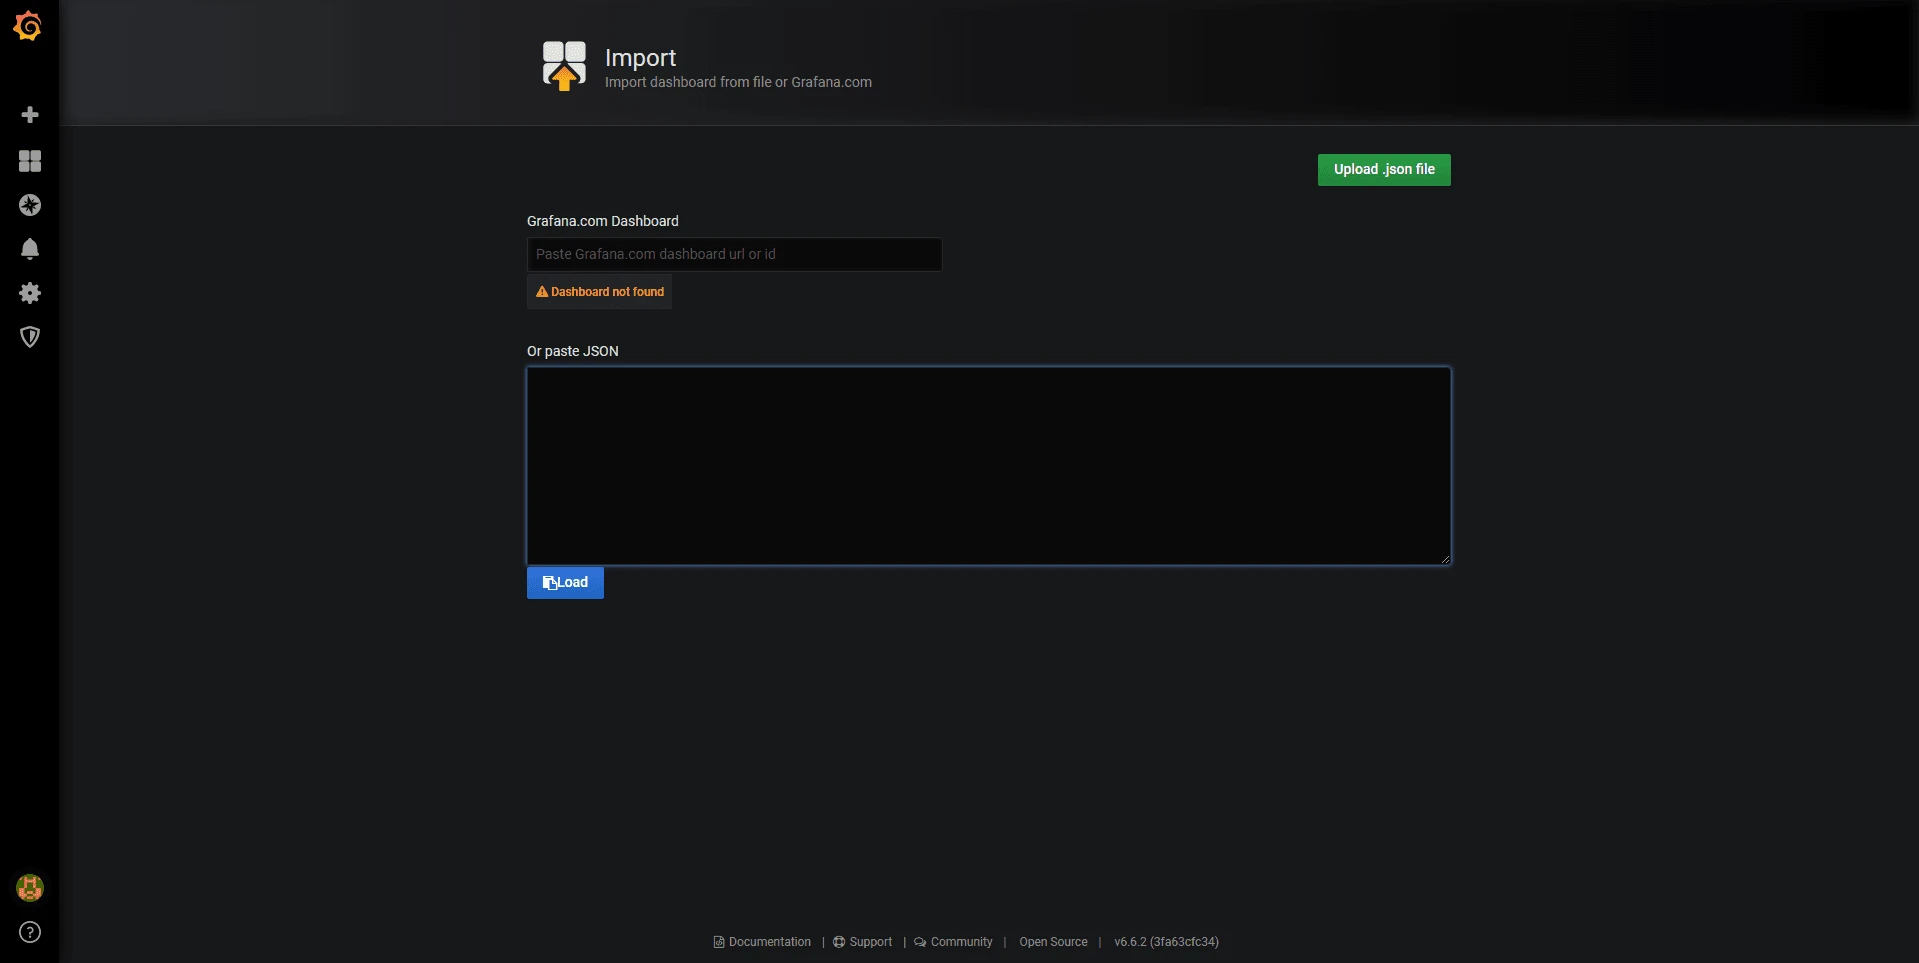
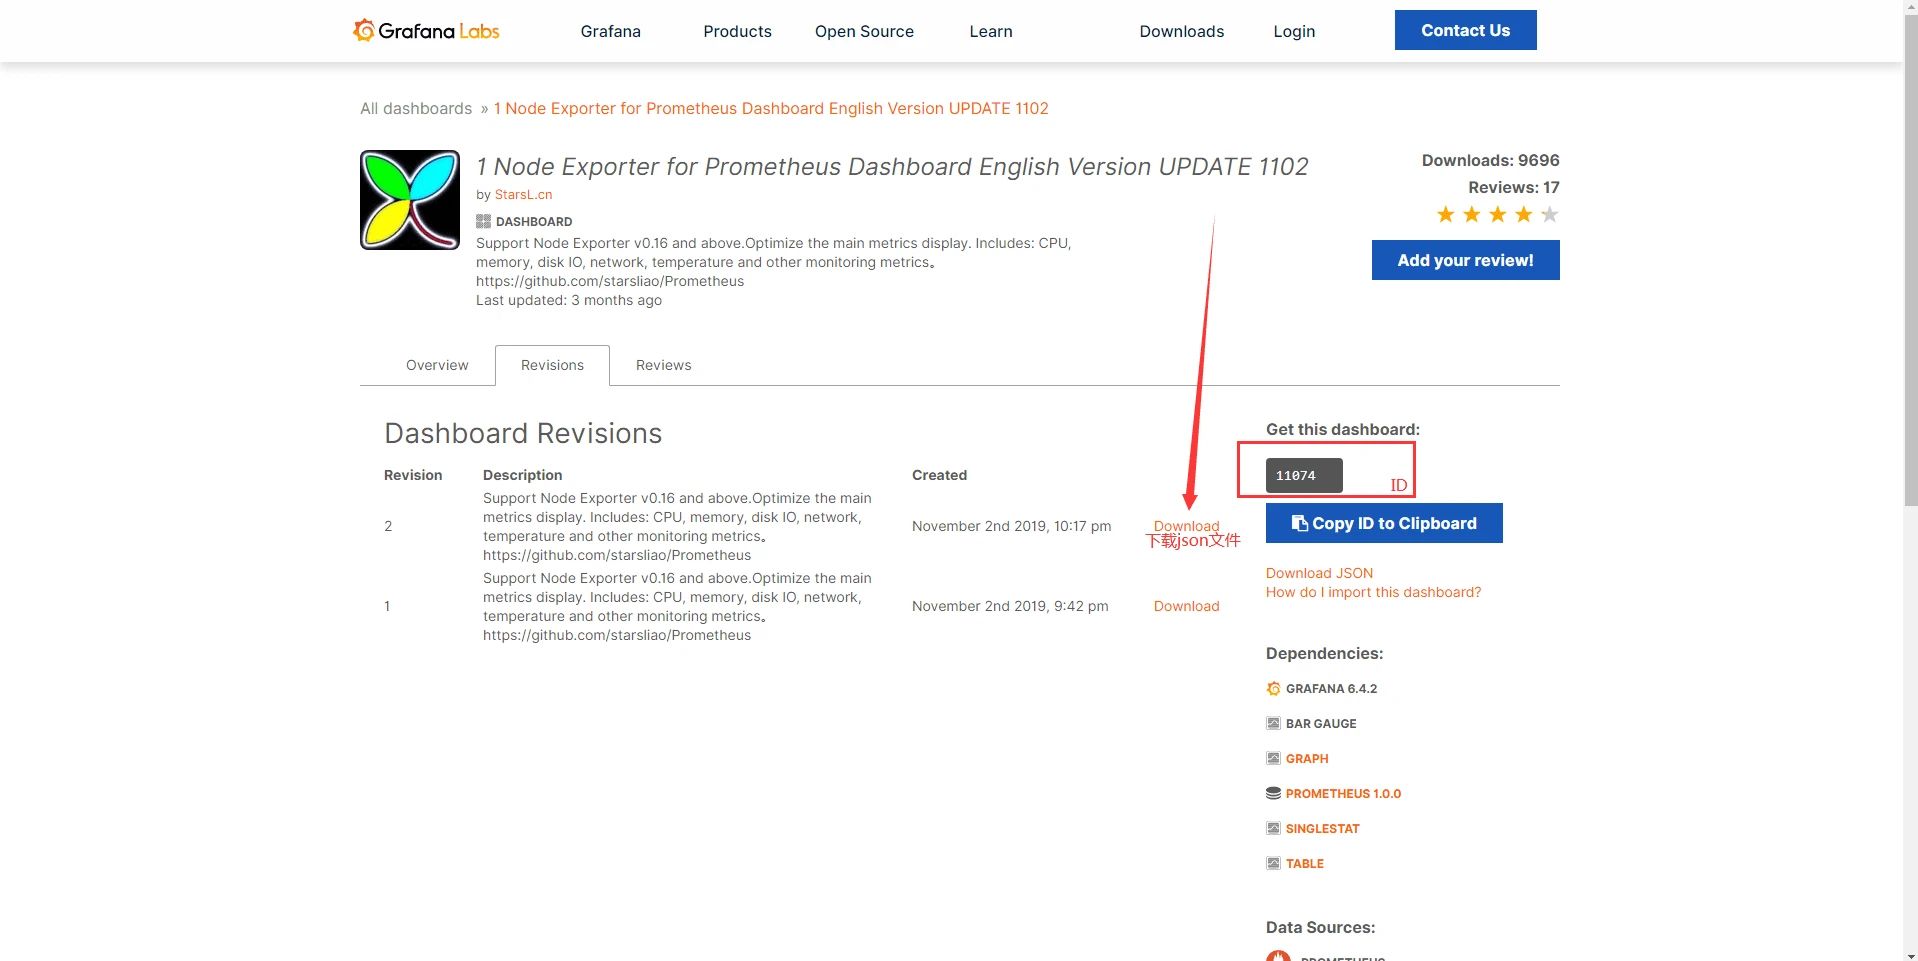
Enter the Dashboards json file downloaded from the official site, or use the Dashboards ID to retrieve it
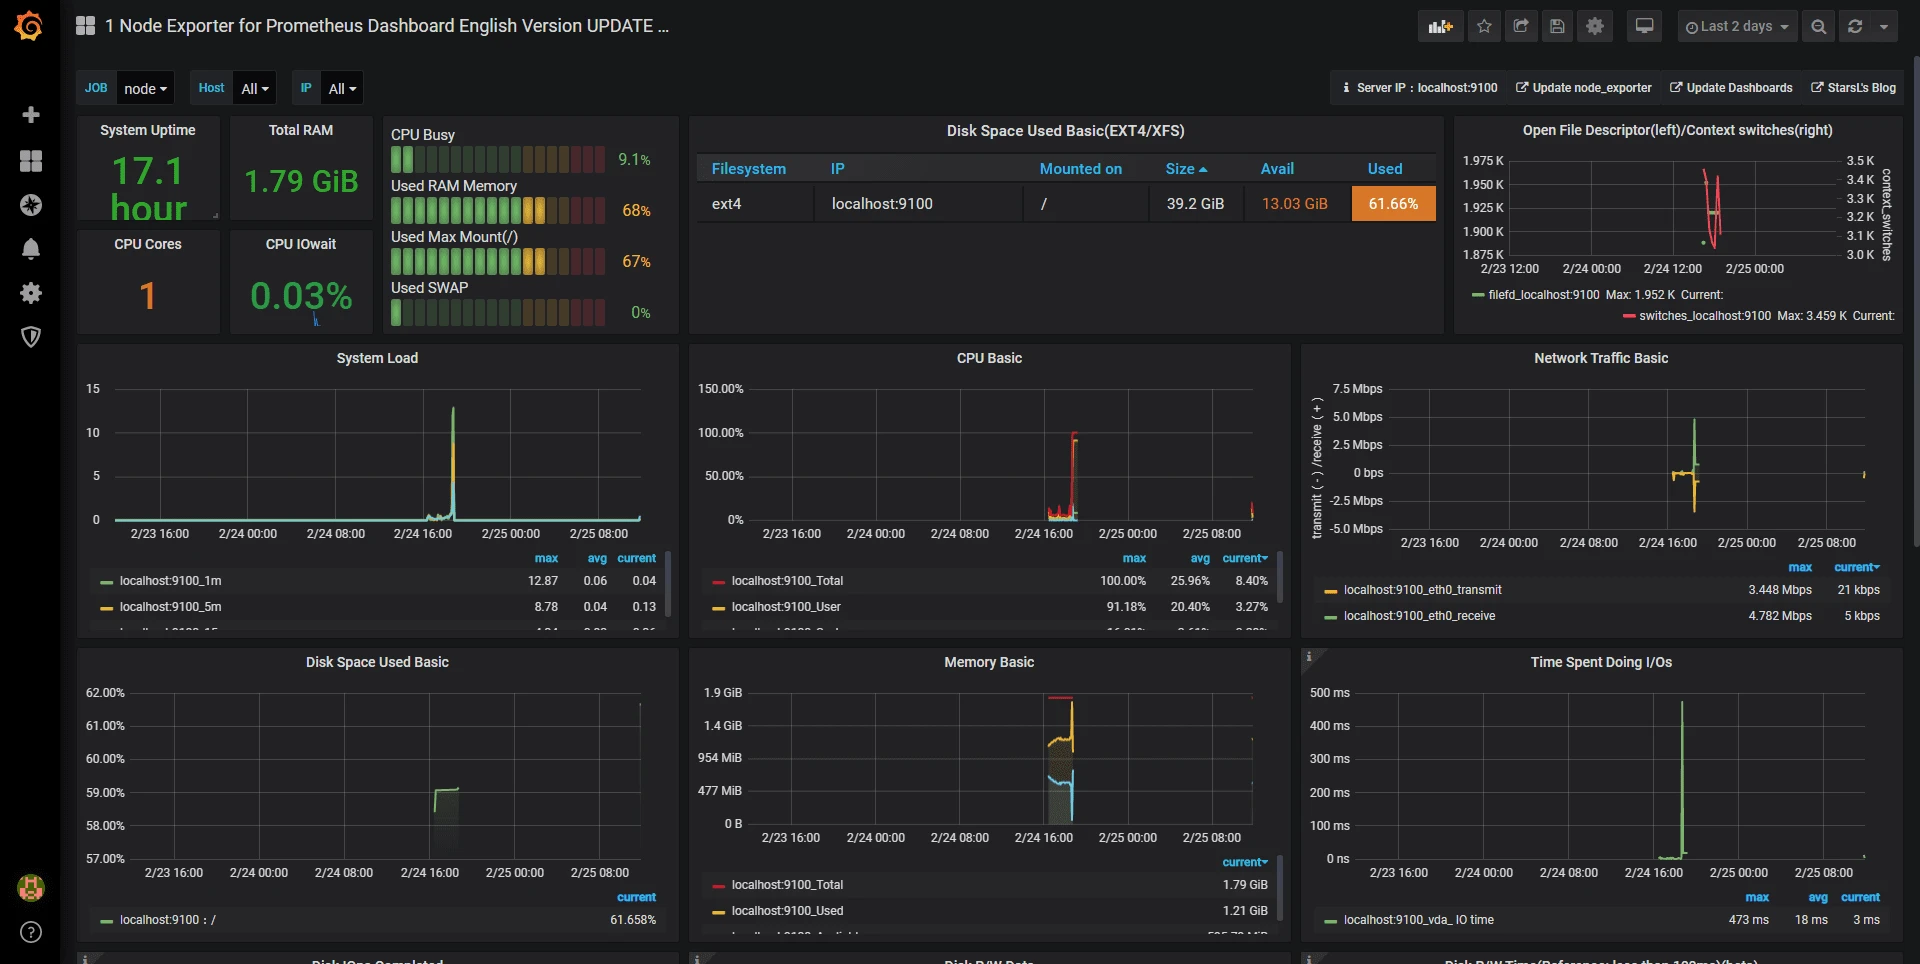
Take a look at the effect
Done
Comments
Discussion
Be kind and keep the discussion friendly.
Discussion
0 comments