

Deploy the Apisix gateway + graphical management in five minutes with Docker compose
Repost license
Request authorization before reposting and retain the authorization code, original URL, and go/affiliate links.
Original URL:https://www.geekcorelab.com/post/docker-compose-five-minute-deployment-of-apisix
The commercial link is an authorized go short link that must stay on the reposted page. It records the source before sending readers to the original article.
First, let's confirm that Git and Vim are already installed on the server, since we'll need them later
Since we are using Ubuntu, the commands are
apt-get update
apt-get install git vim -y
After the execution is complete, clone the official repository
git clone https://github.com/apache/apisix-docker.git
cd apisix-docker/example
Next, there is one more thing we need to do: copy the dashboard configuration file over. The official setup places it in the all-in-one directory; we will put it in the same directory as the docker-compose file, which makes it easier to mount into the container.
cp ../all-in-one/apisix-dashboard ./
Modify the docker-compose.yml file. If you don't want to modify it, you can just delete it and create a new one, then fill in the content below.
version: "3"

services:
  apisix:
    image: apache/apisix:${APISIX_IMAGE_TAG:-3.9.0-debian}
    # 如果不手动指定版本,则默认使用官方的3.9.0(官方的示例中写的,但是最新版已经到3.10.0了
    restart: always
    volumes:
      - ./apisix_conf/config.yaml:/usr/local/apisix/conf/config.yaml:ro
    depends_on:
      - etcd
    ports:
      - "9180:9180/tcp"
      - "9080:9080/tcp"
      - "9091:9091/tcp"
      - "9443:9443/tcp"
      - "9092:9092/tcp"
    networks:
      apisix:

  etcd:
    image: bitnami/etcd:3.5.11
    restart: always
    volumes:
      - etcd_data:/bitnami/etcd
    environment:
      ETCD_ENABLE_V2: "true"
      ALLOW_NONE_AUTHENTICATION: "yes"
      ETCD_ADVERTISE_CLIENT_URLS: "http://etcd:2379"
      ETCD_LISTEN_CLIENT_URLS: "http://0.0.0.0:2379"
    ports:
      - "2379:2379/tcp"
    networks:
      apisix:
  dashboard:
    image: "apache/apisix-dashboard:3.0.0-centos"
    restart: always
    depends_on:
      - etcd
    volumes:
      - ./apisix-dashboard/conf.yaml:/usr/local/apisix-dashboard/conf/conf.yaml:ro
    ports:
      - "9000:9000/tcp"
    networks:
      - apisix
  # 官方版本这里有两个nginx的容器,为了是测试用的,但我们不需要它,所以这里直接删掉了
  prometheus:
    image: prom/prometheus:v2.25.0
    restart: always
    volumes:
      - ./prometheus_conf/prometheus.yml:/etc/prometheus/prometheus.yml
    ports:
      - "9090:9090"
    networks:
      apisix:
  grafana:
    image: grafana/grafana:7.3.7
    restart: always
    ports:
      - "3000:3000"
    volumes:
      - "./grafana_conf/provisioning:/etc/grafana/provisioning"
      - "./grafana_conf/dashboards:/var/lib/grafana/dashboards"
      - "./grafana_conf/config/grafana.ini:/etc/grafana/grafana.ini"
    networks:
      apisix:
networks:
  apisix:
    driver: bridge

volumes:
  etcd_data:
    driver: local
After that, we can run the command to deploy Apisix
docker compose up -d
The directory structure after deployment looks like this
Next, we can check the default username and password, and visit the web page to log in and manage it. Access your server IP plus the port; the port is 9000. However, since port 9000 on my machine was already taken, I changed it to 29000. So with my server IP, the access address is as follows:
http://100.101.110.53:29000/
cat ./apisix-dashboard/conf.yaml
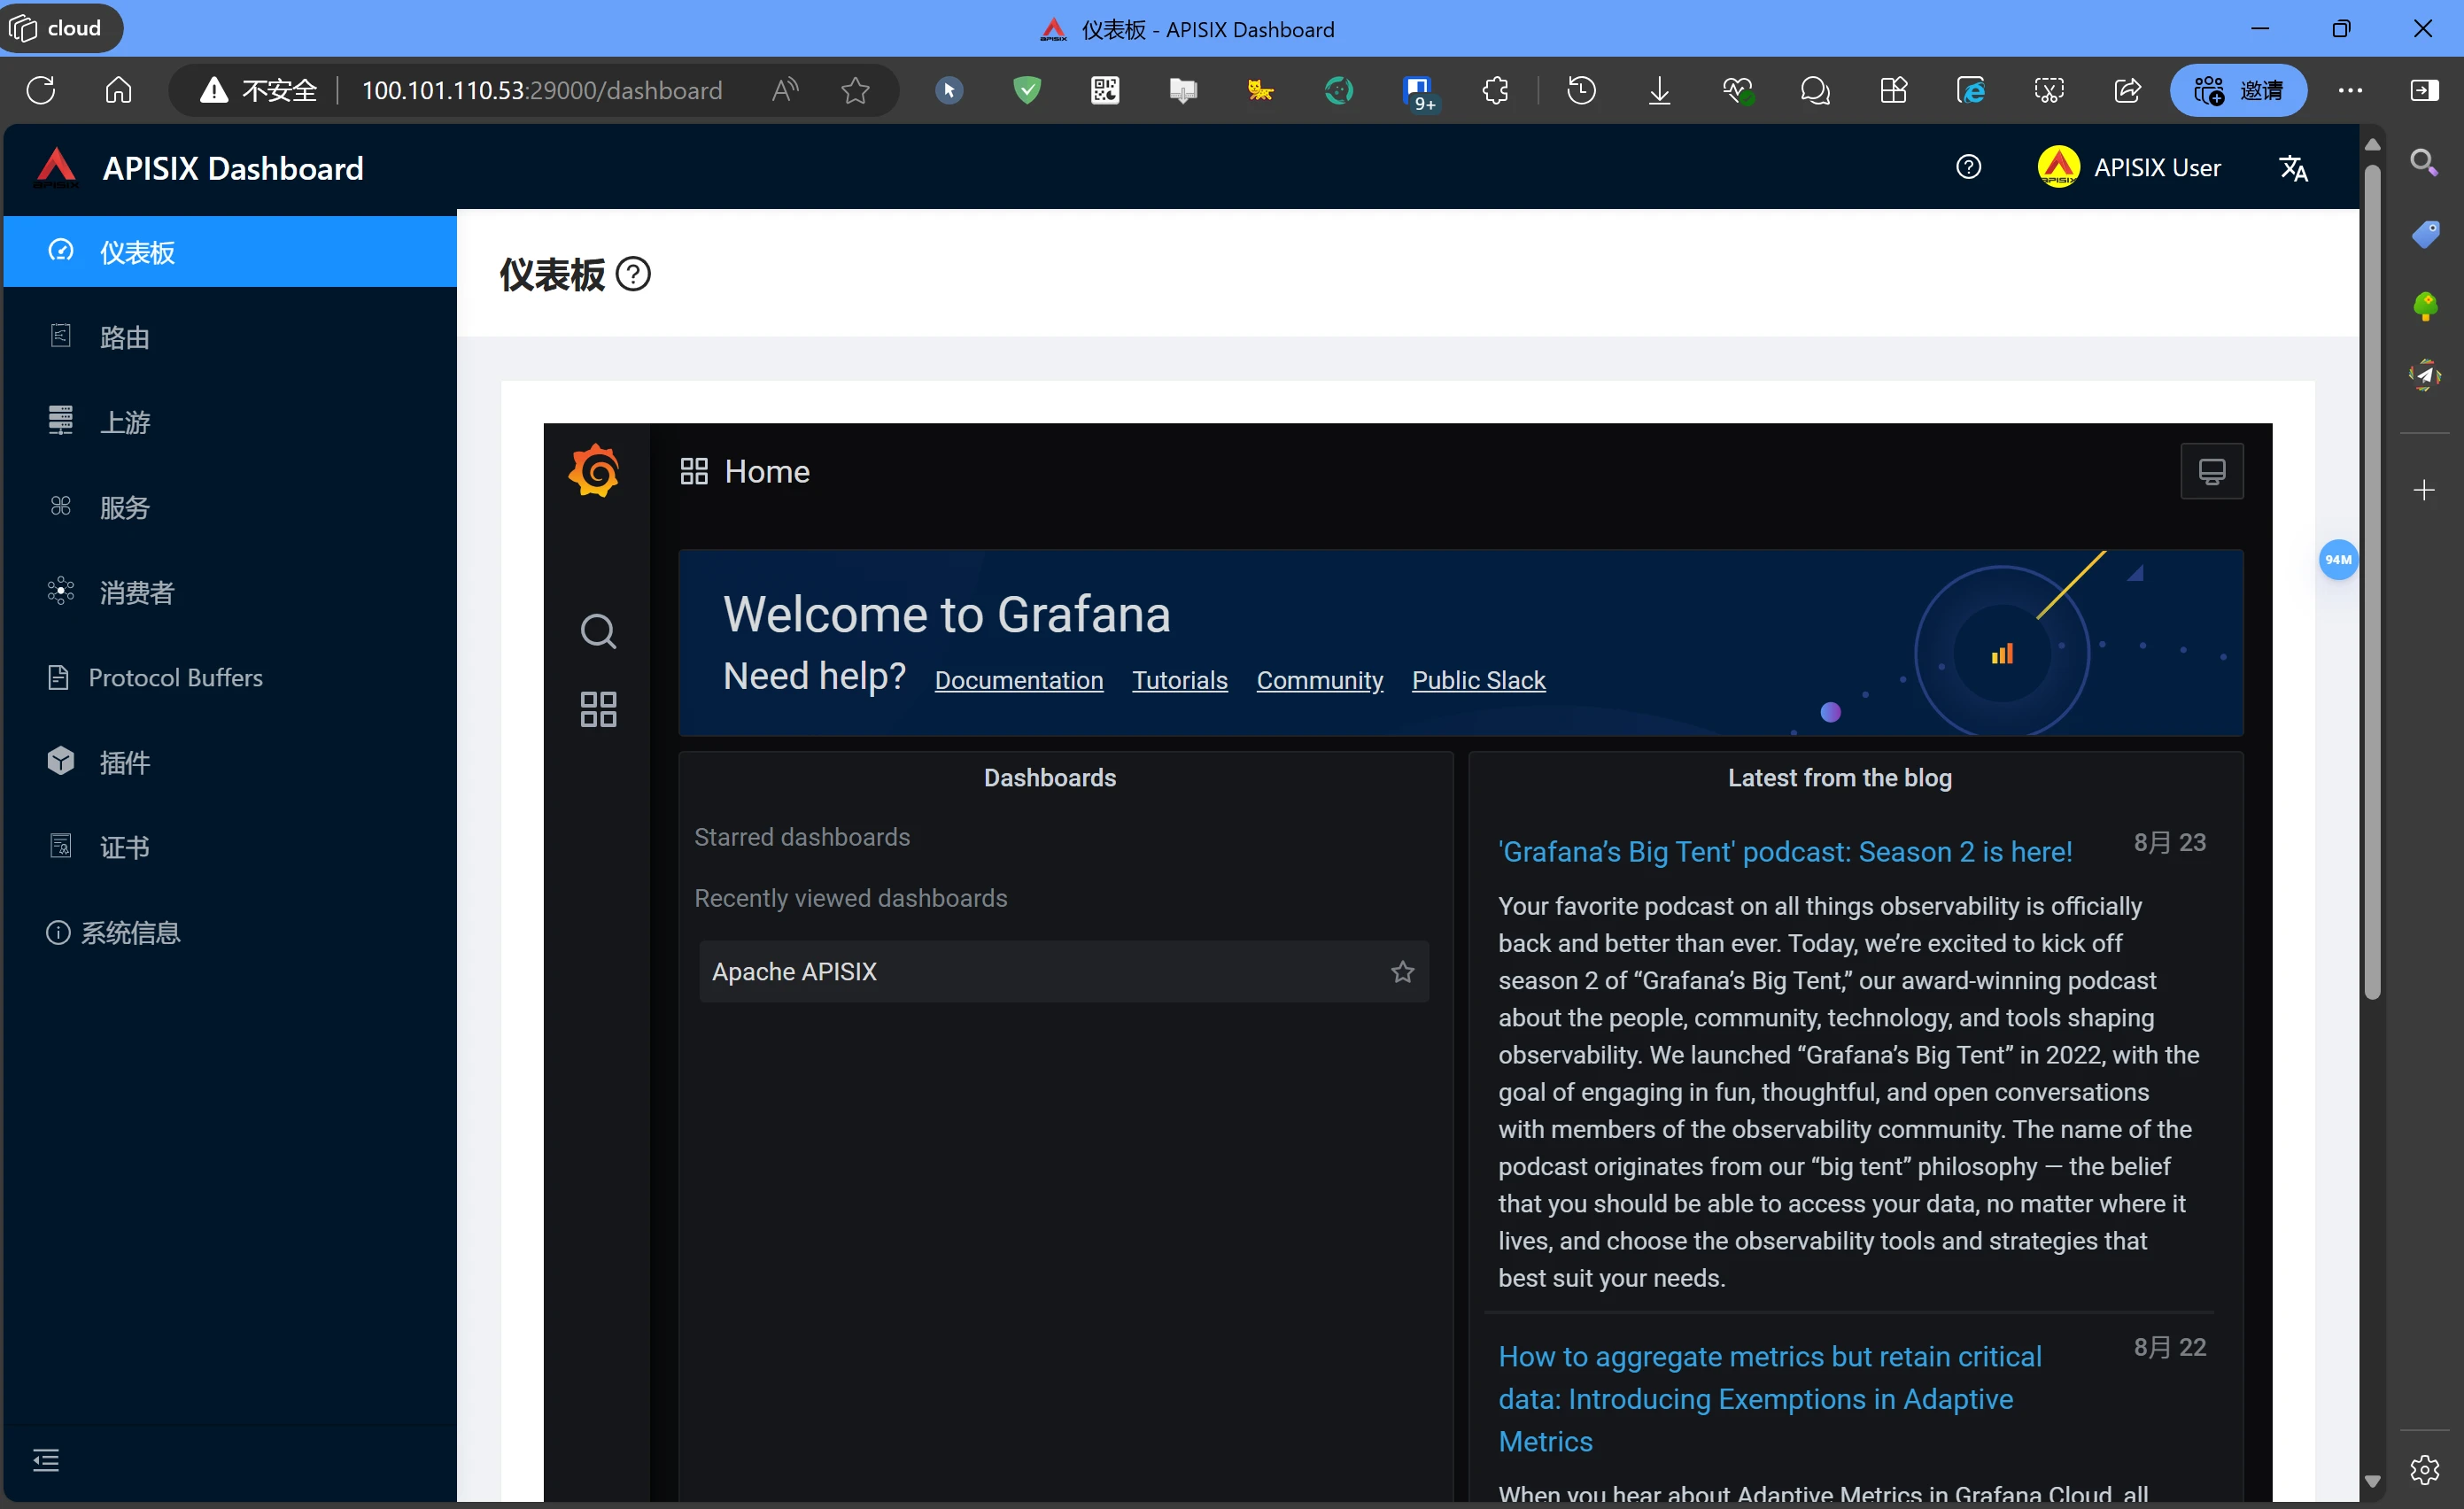
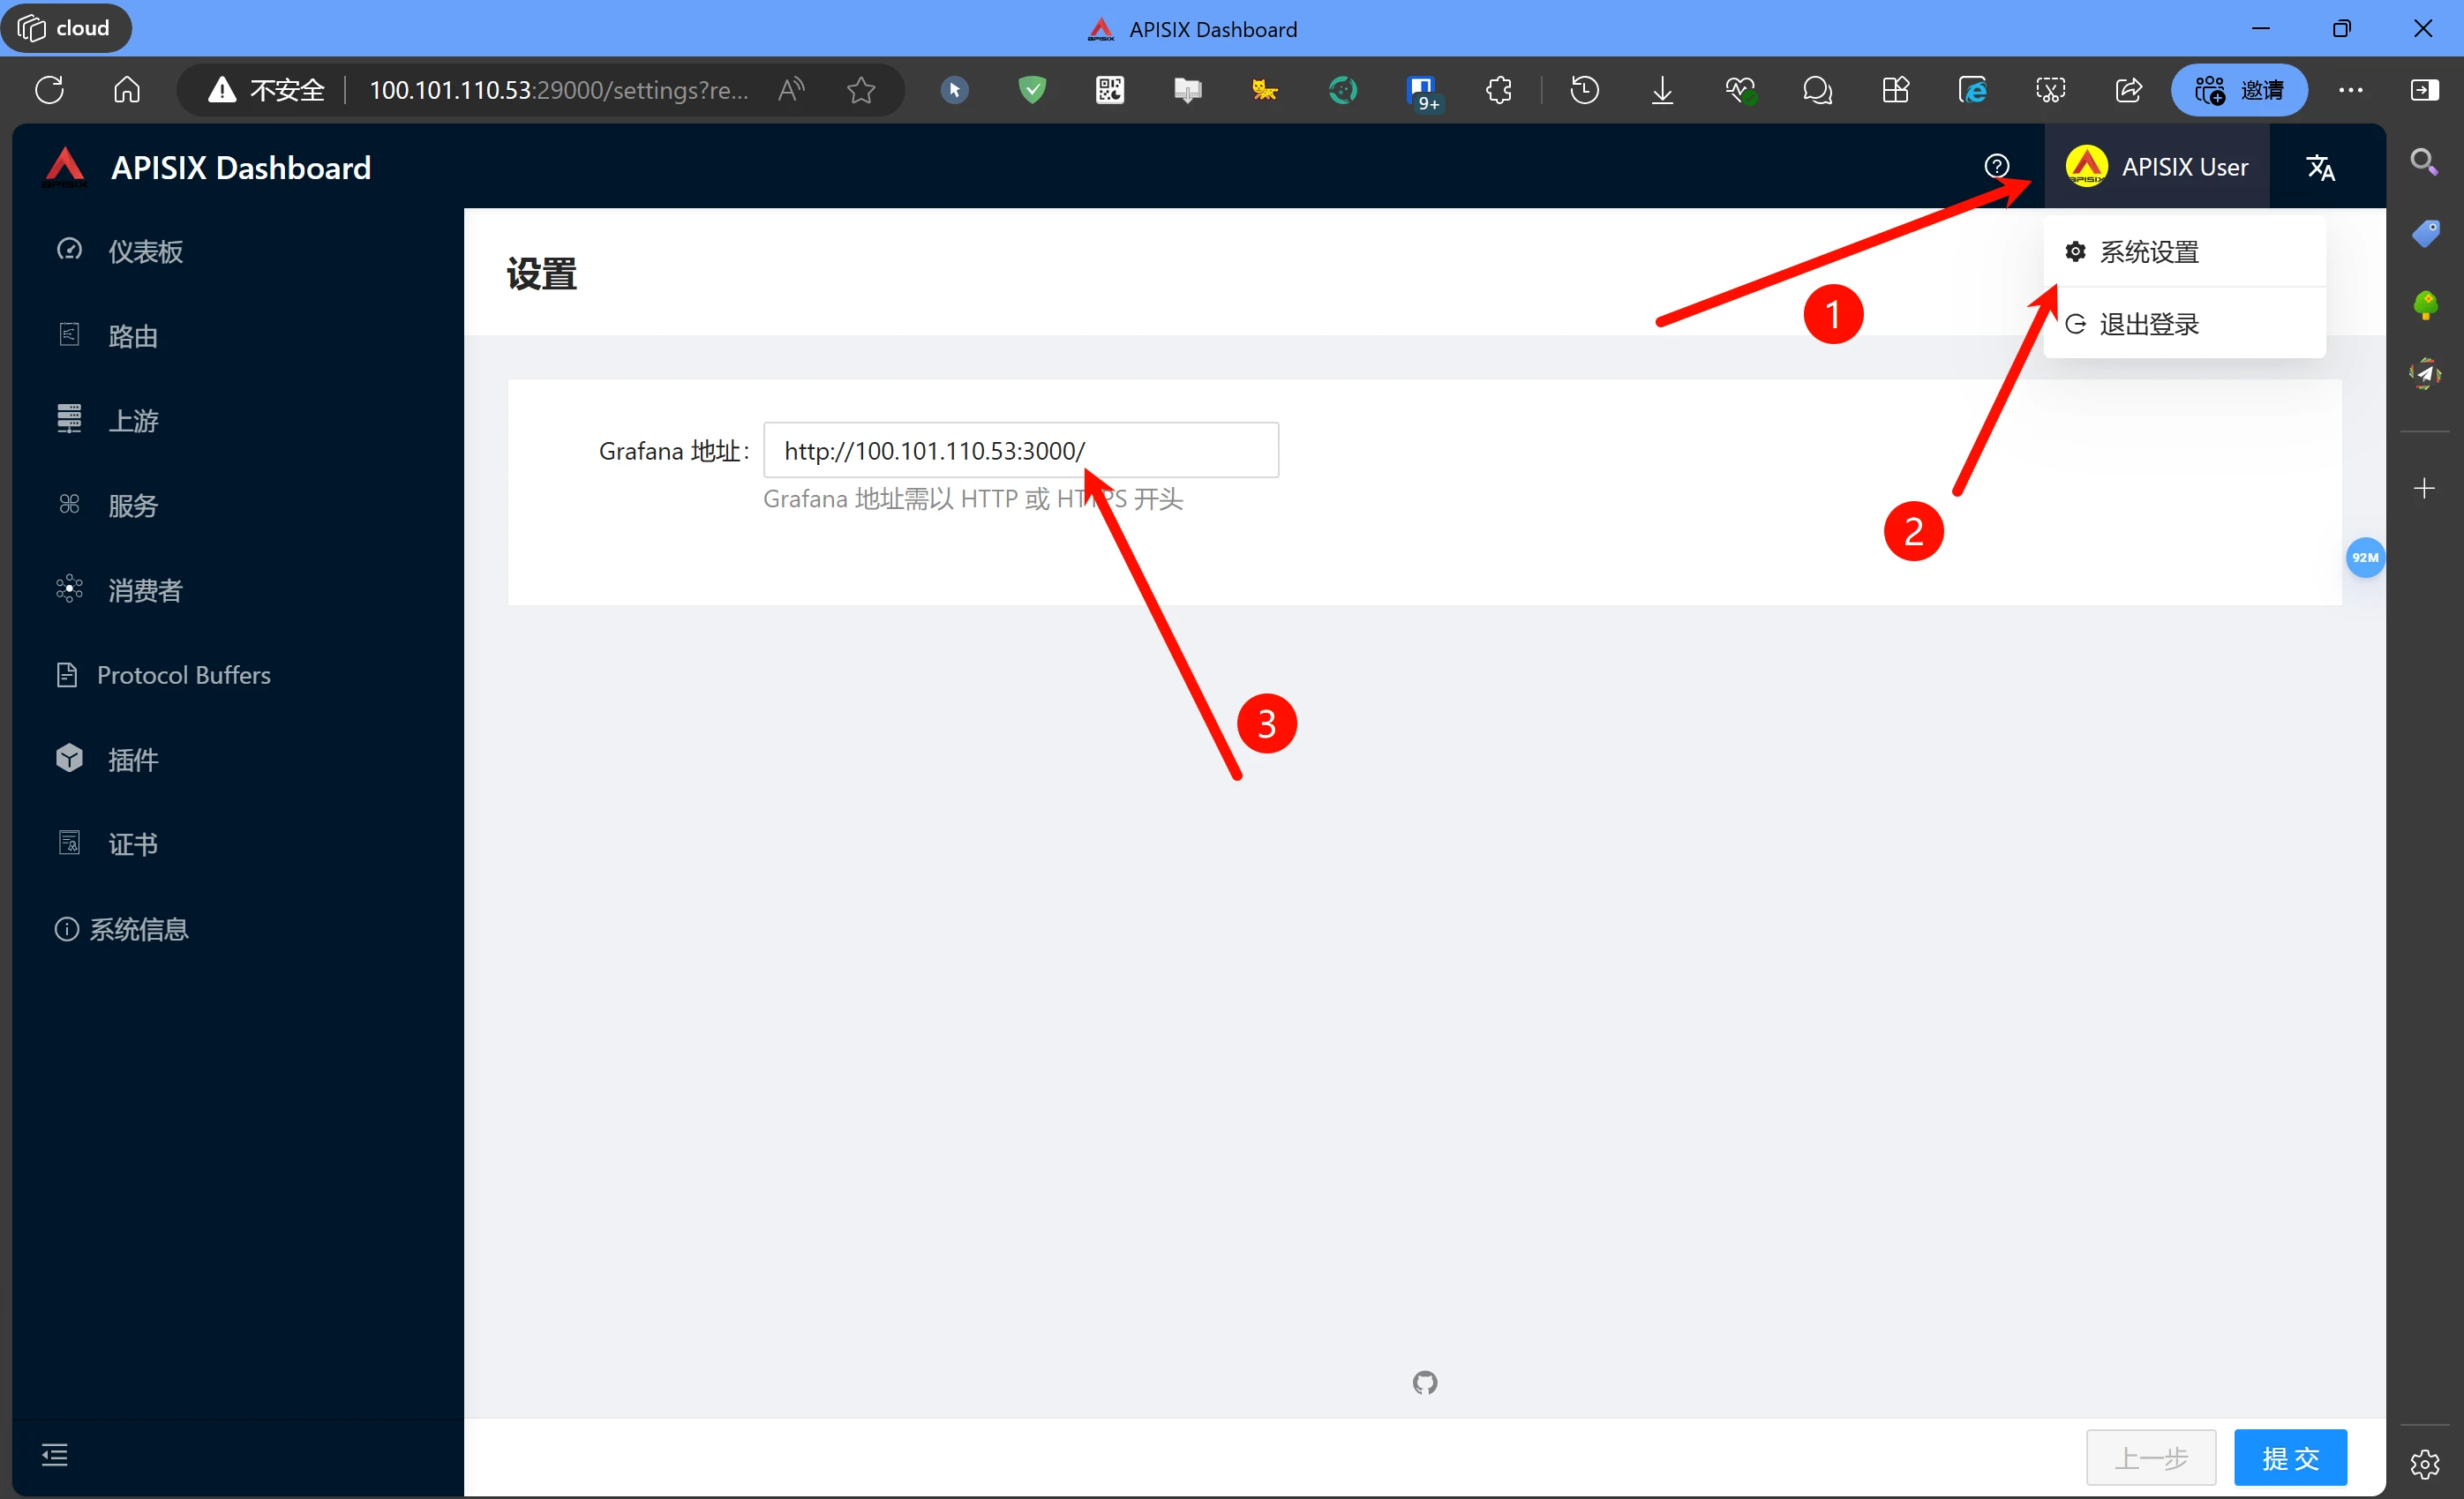
After logging in, you will be redirected to the dashboard page. If it prompts that Grafana is not configured, you can configure it here:
The address to enter is also your server IP plus port, but here you need to include http://. The default port of Grafana is 3000.
We can also view the monitoring information by opening this address directly
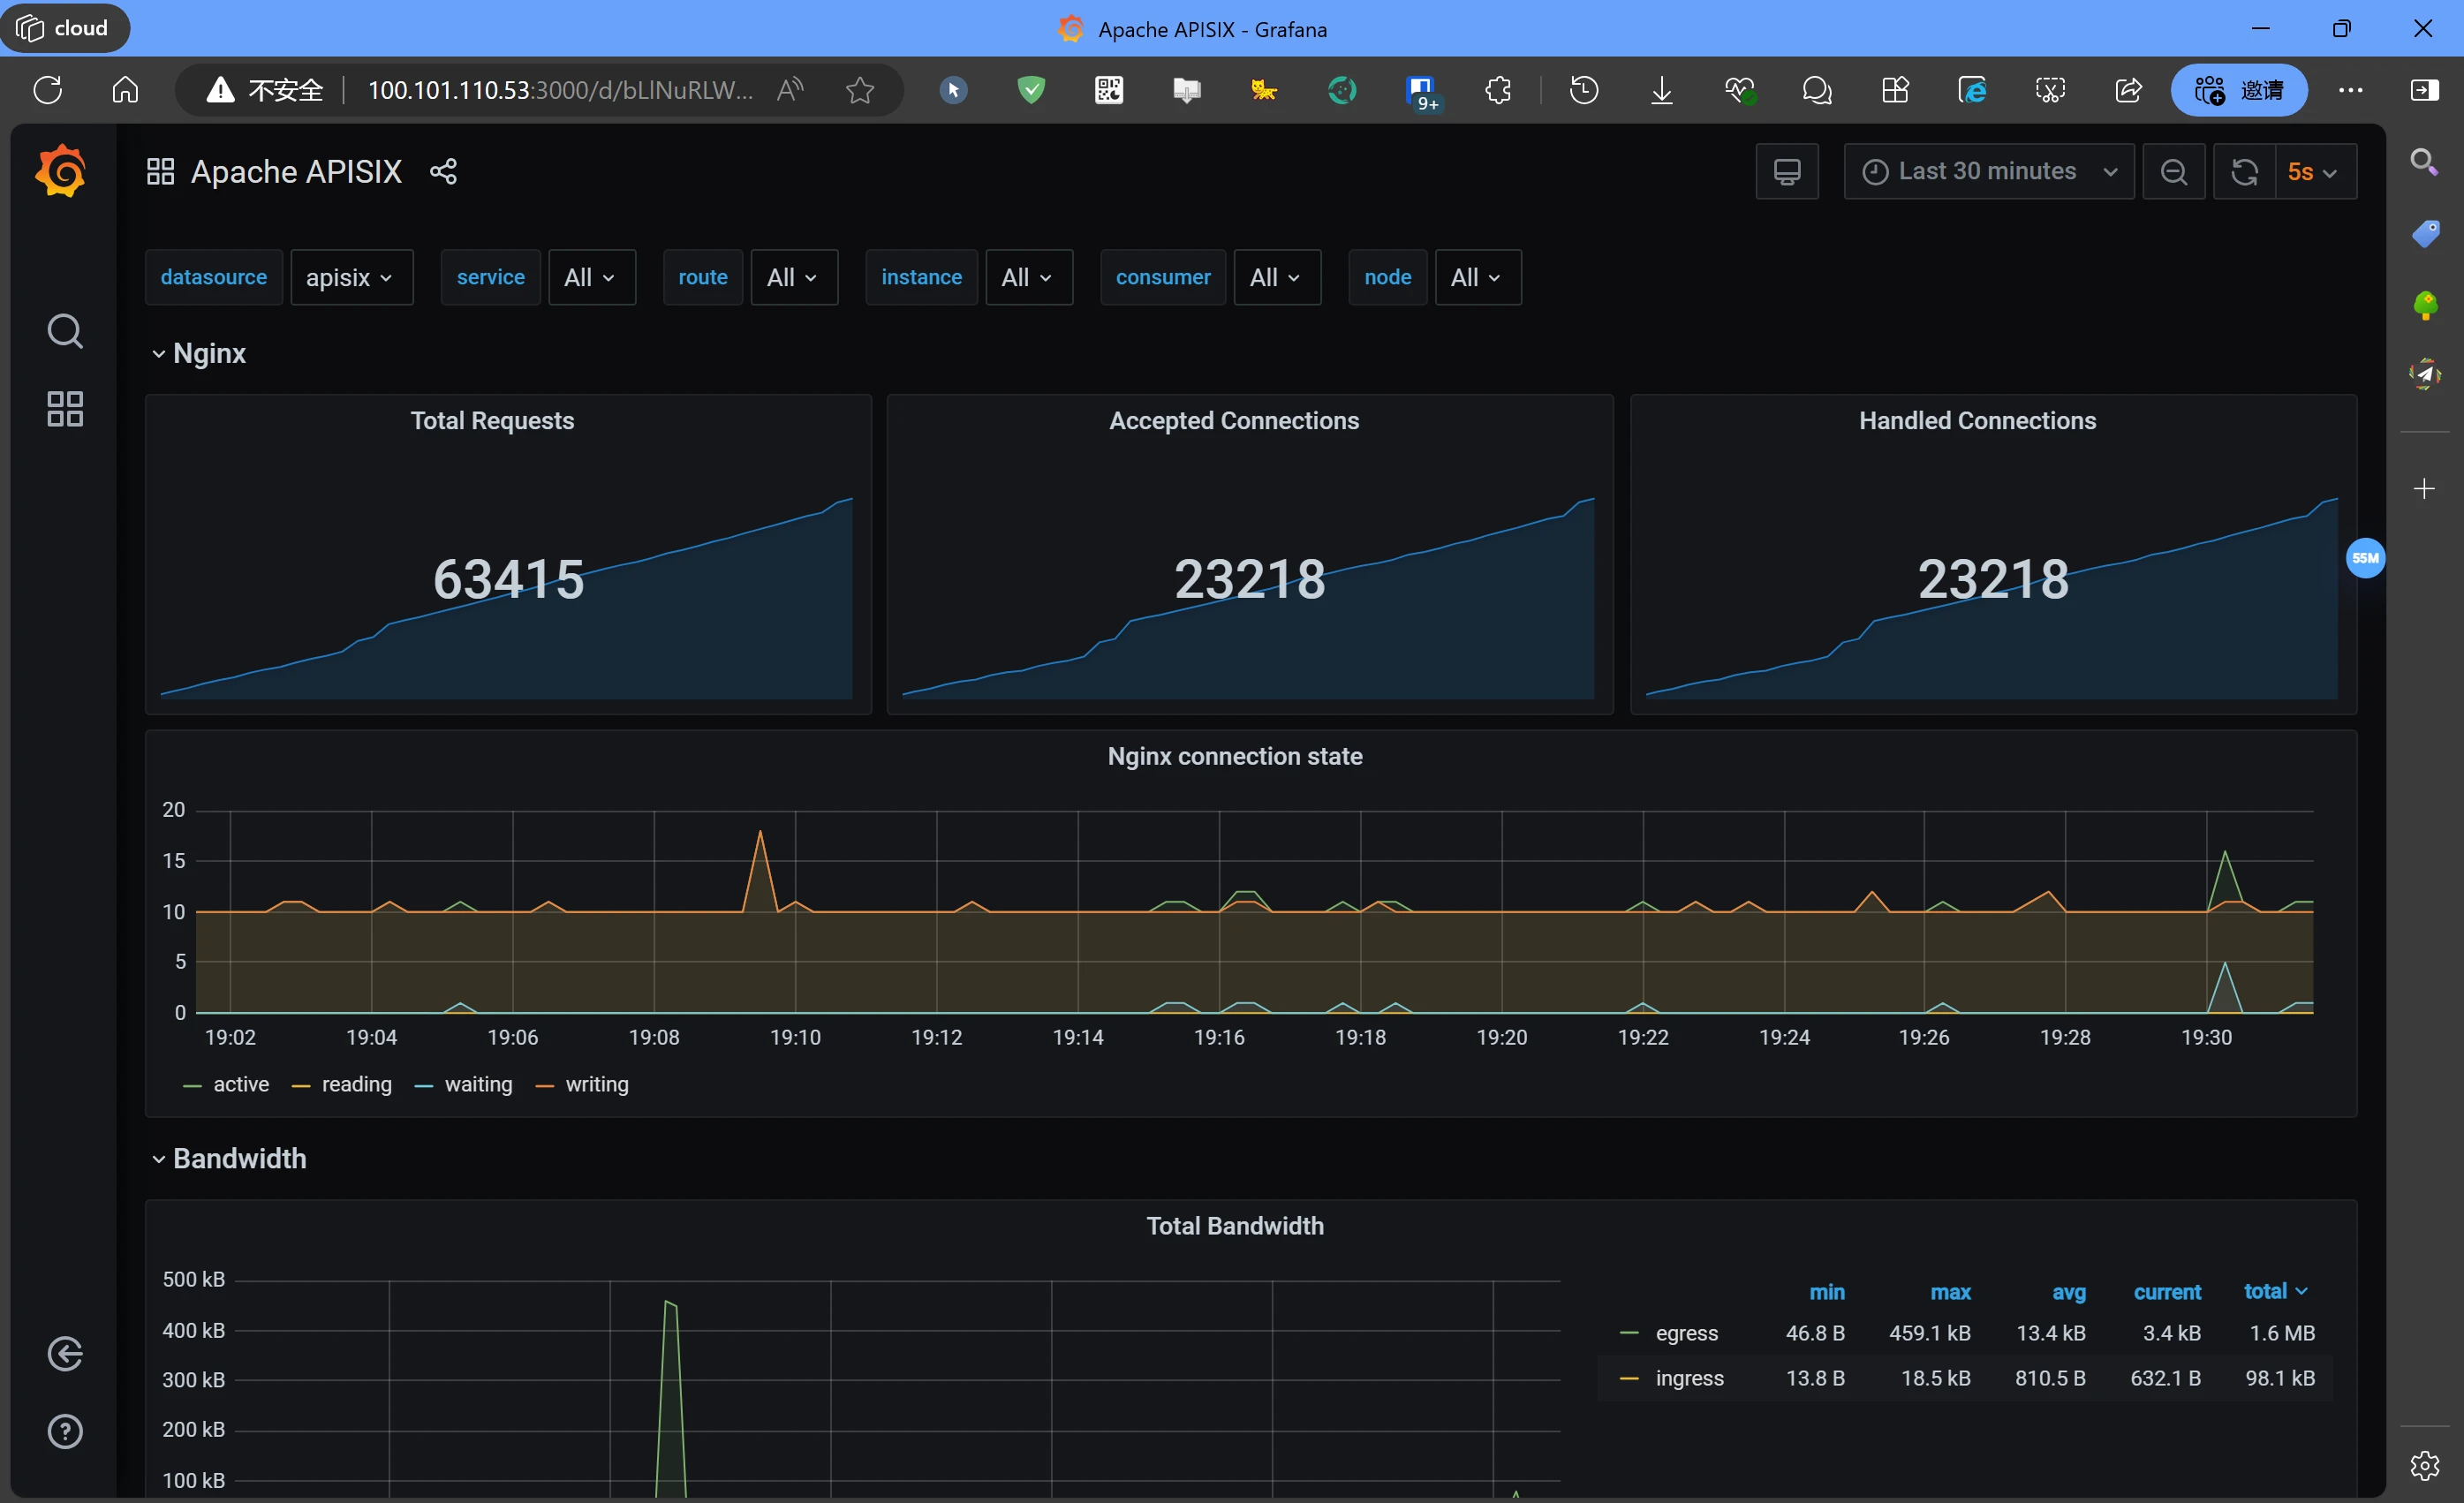
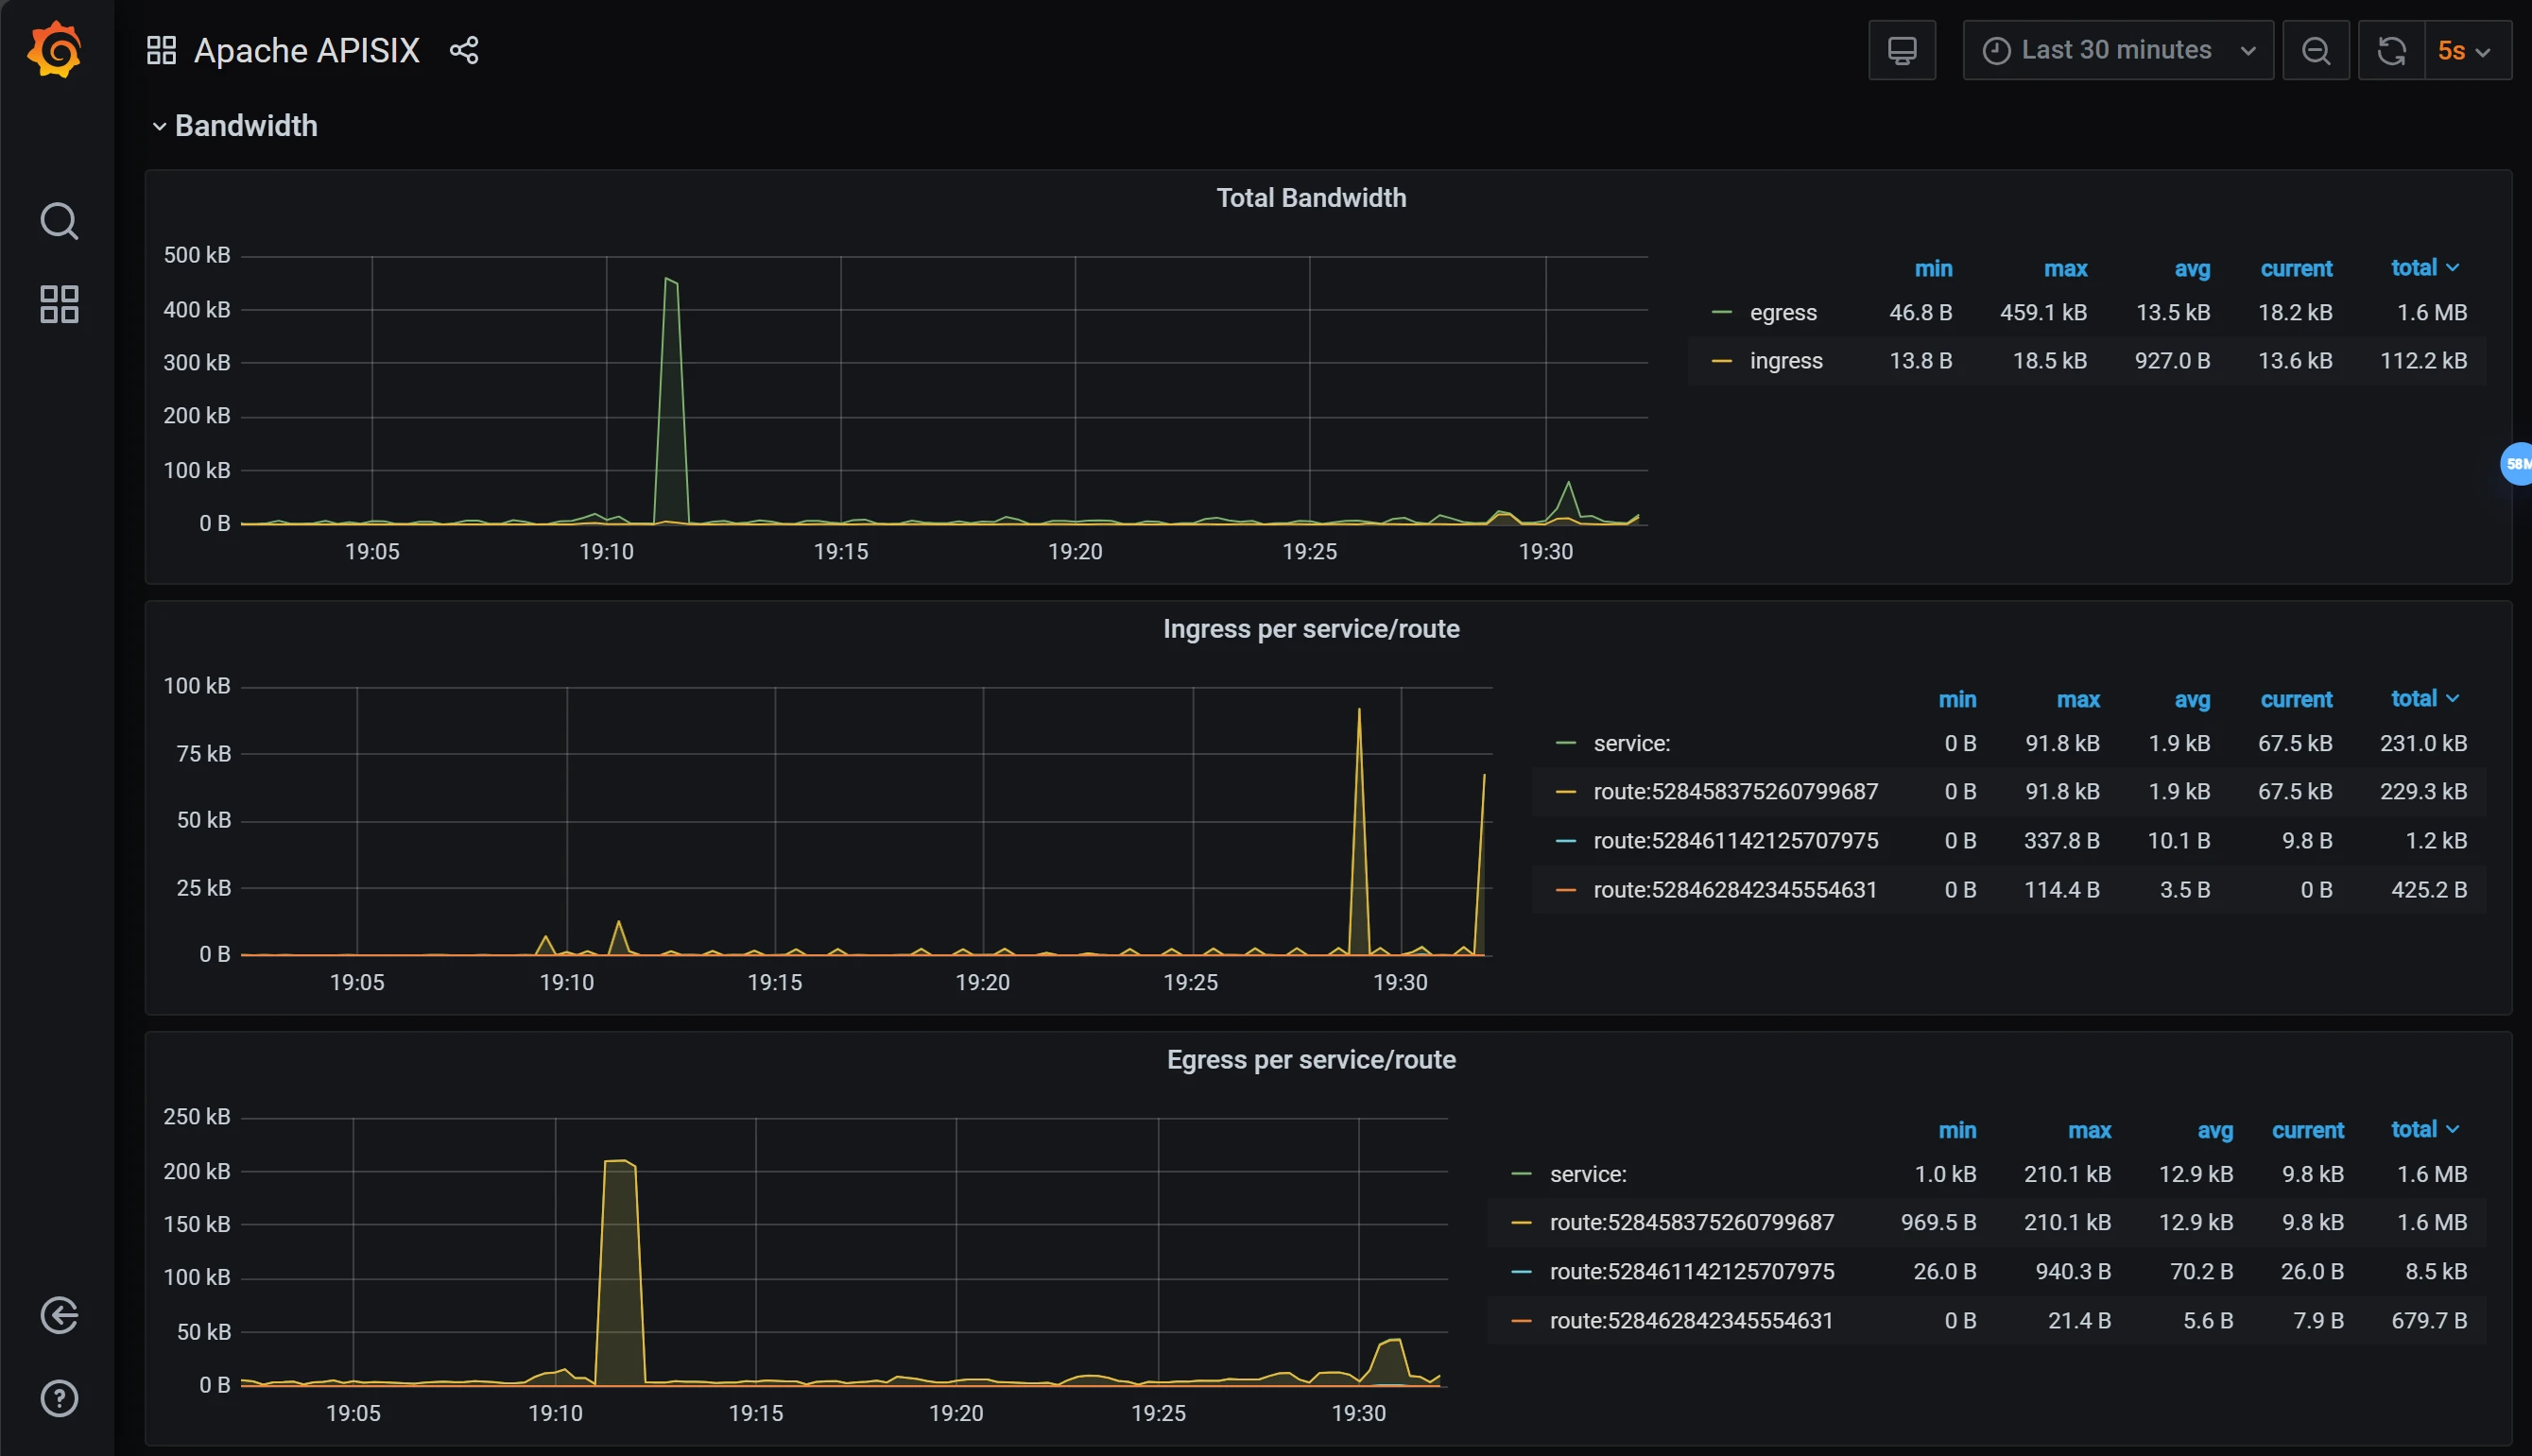
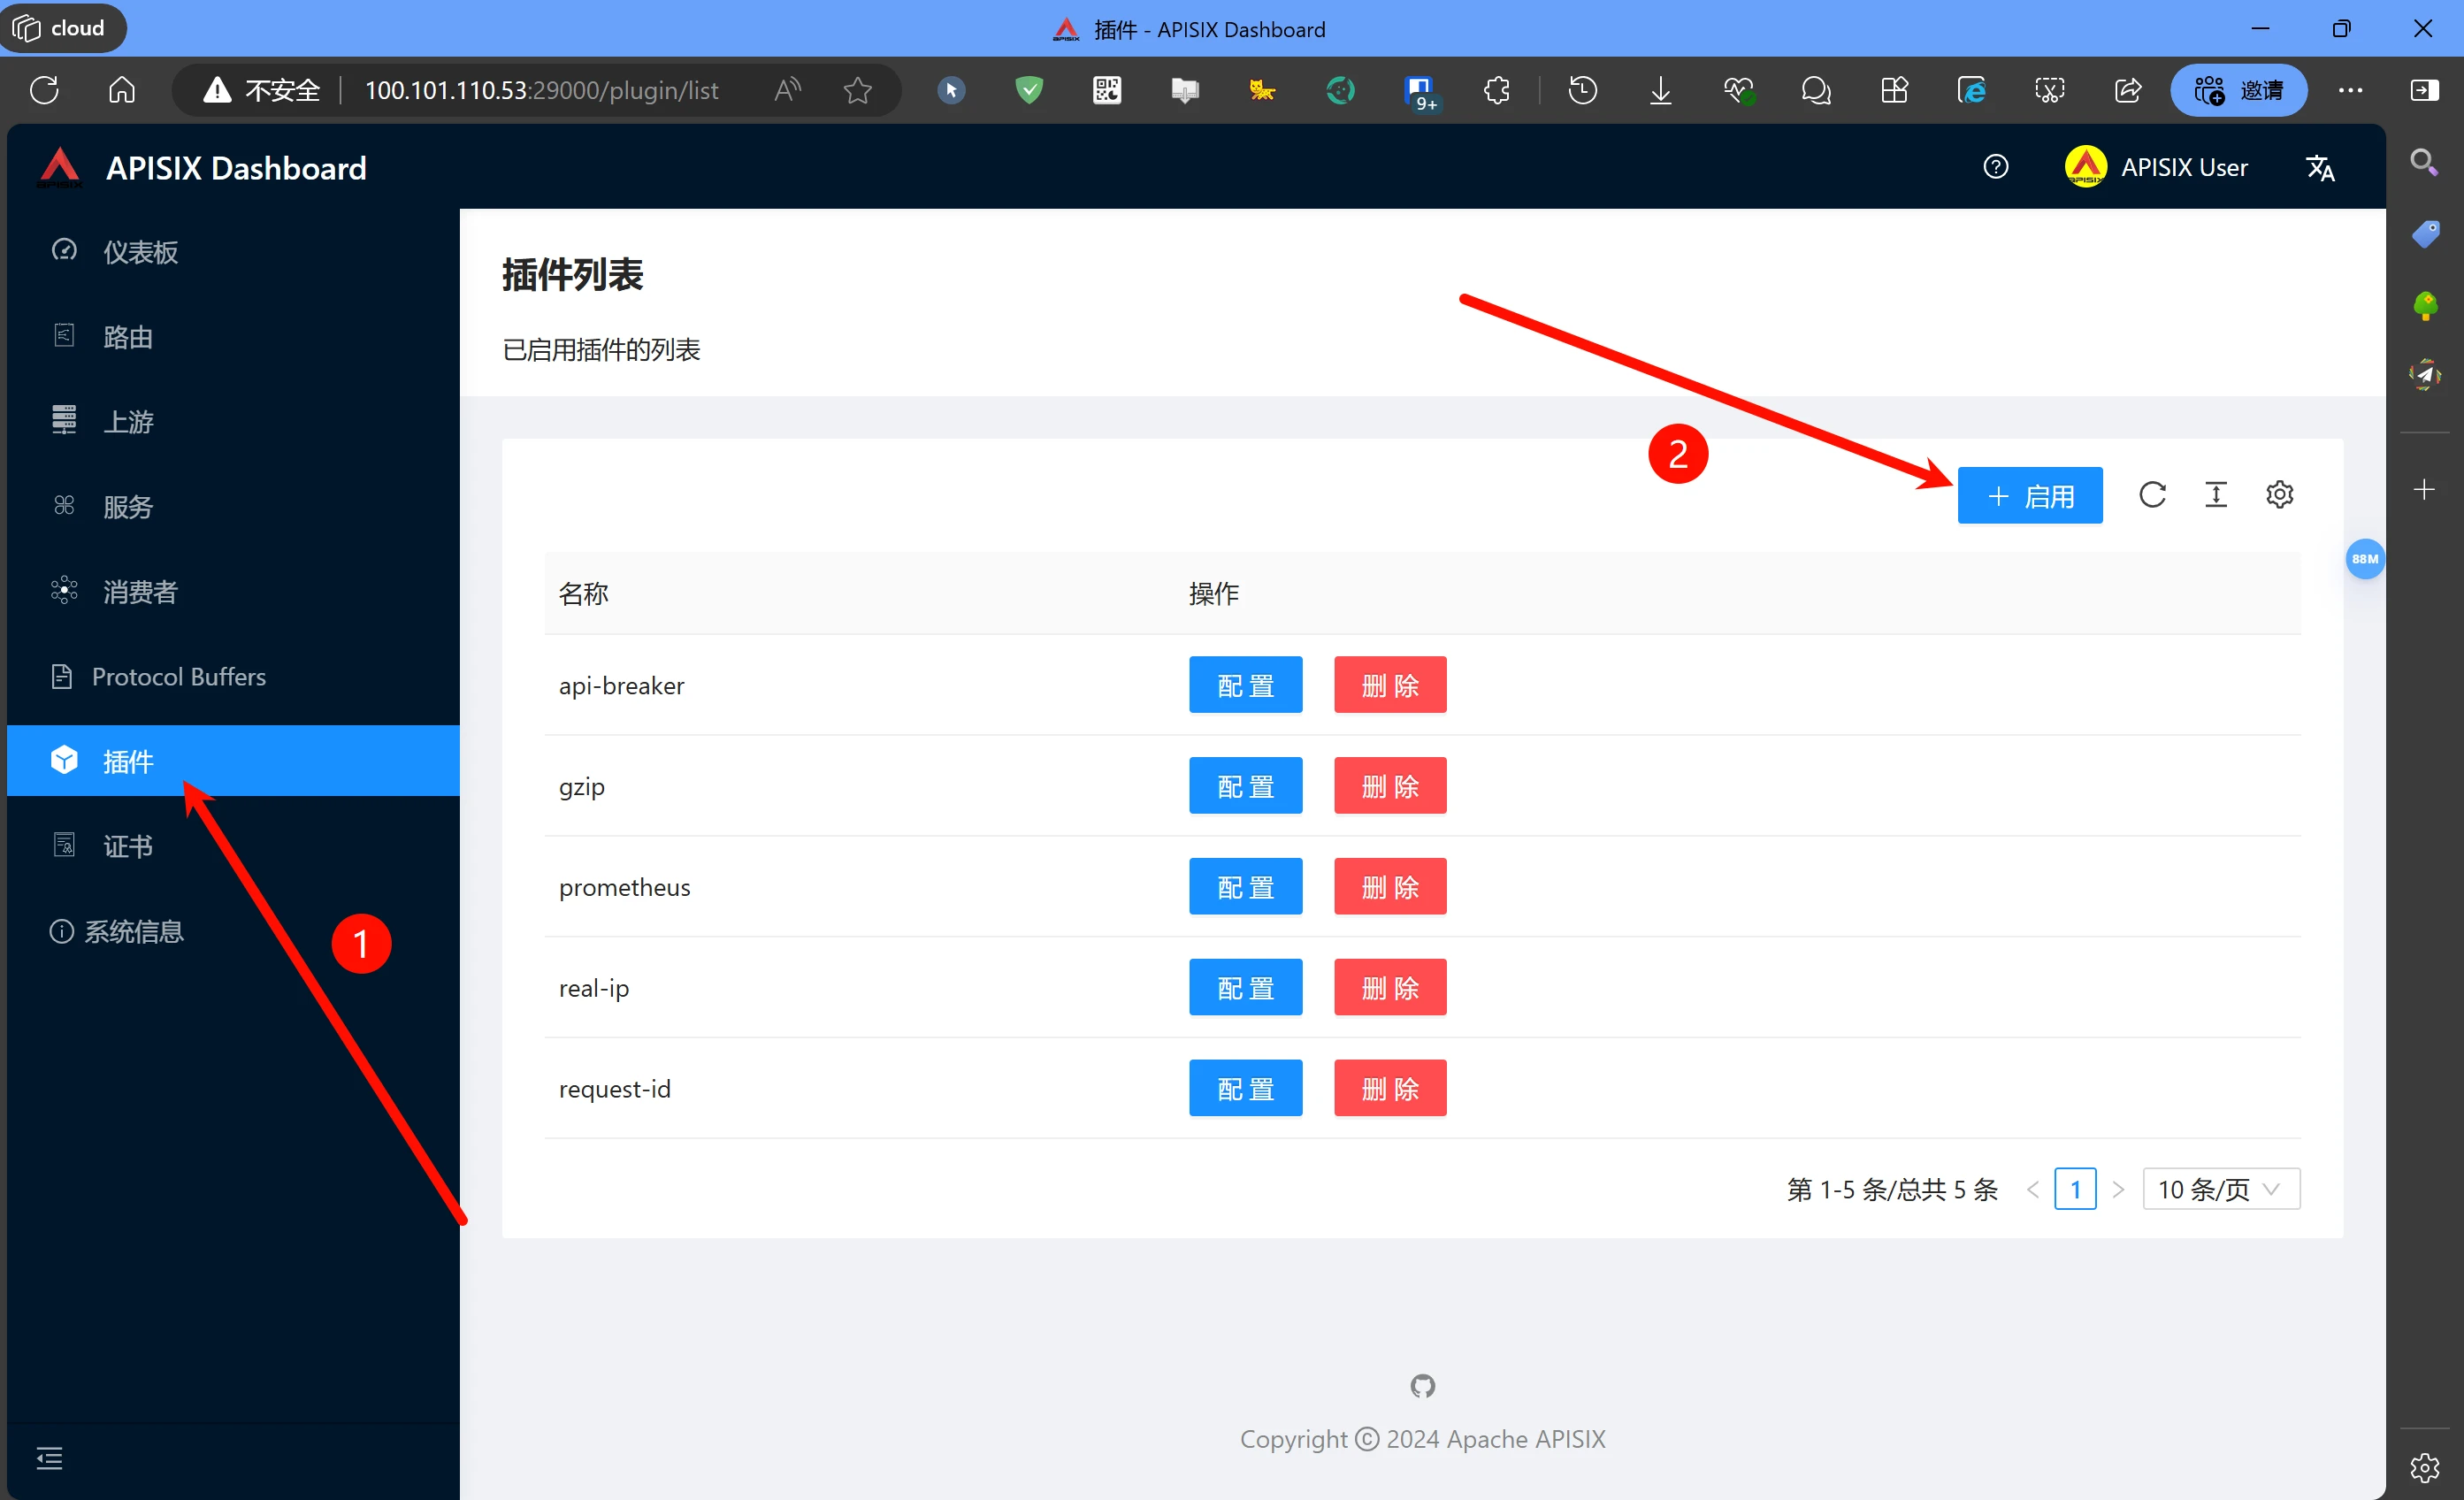
But by default all of these have no data; only Nginx has monitoring data, and Apisix's monitoring data is not being passed over. So how do we solve this problem? Let's go back to the Apisix web management page and add a plugin by following the steps below.
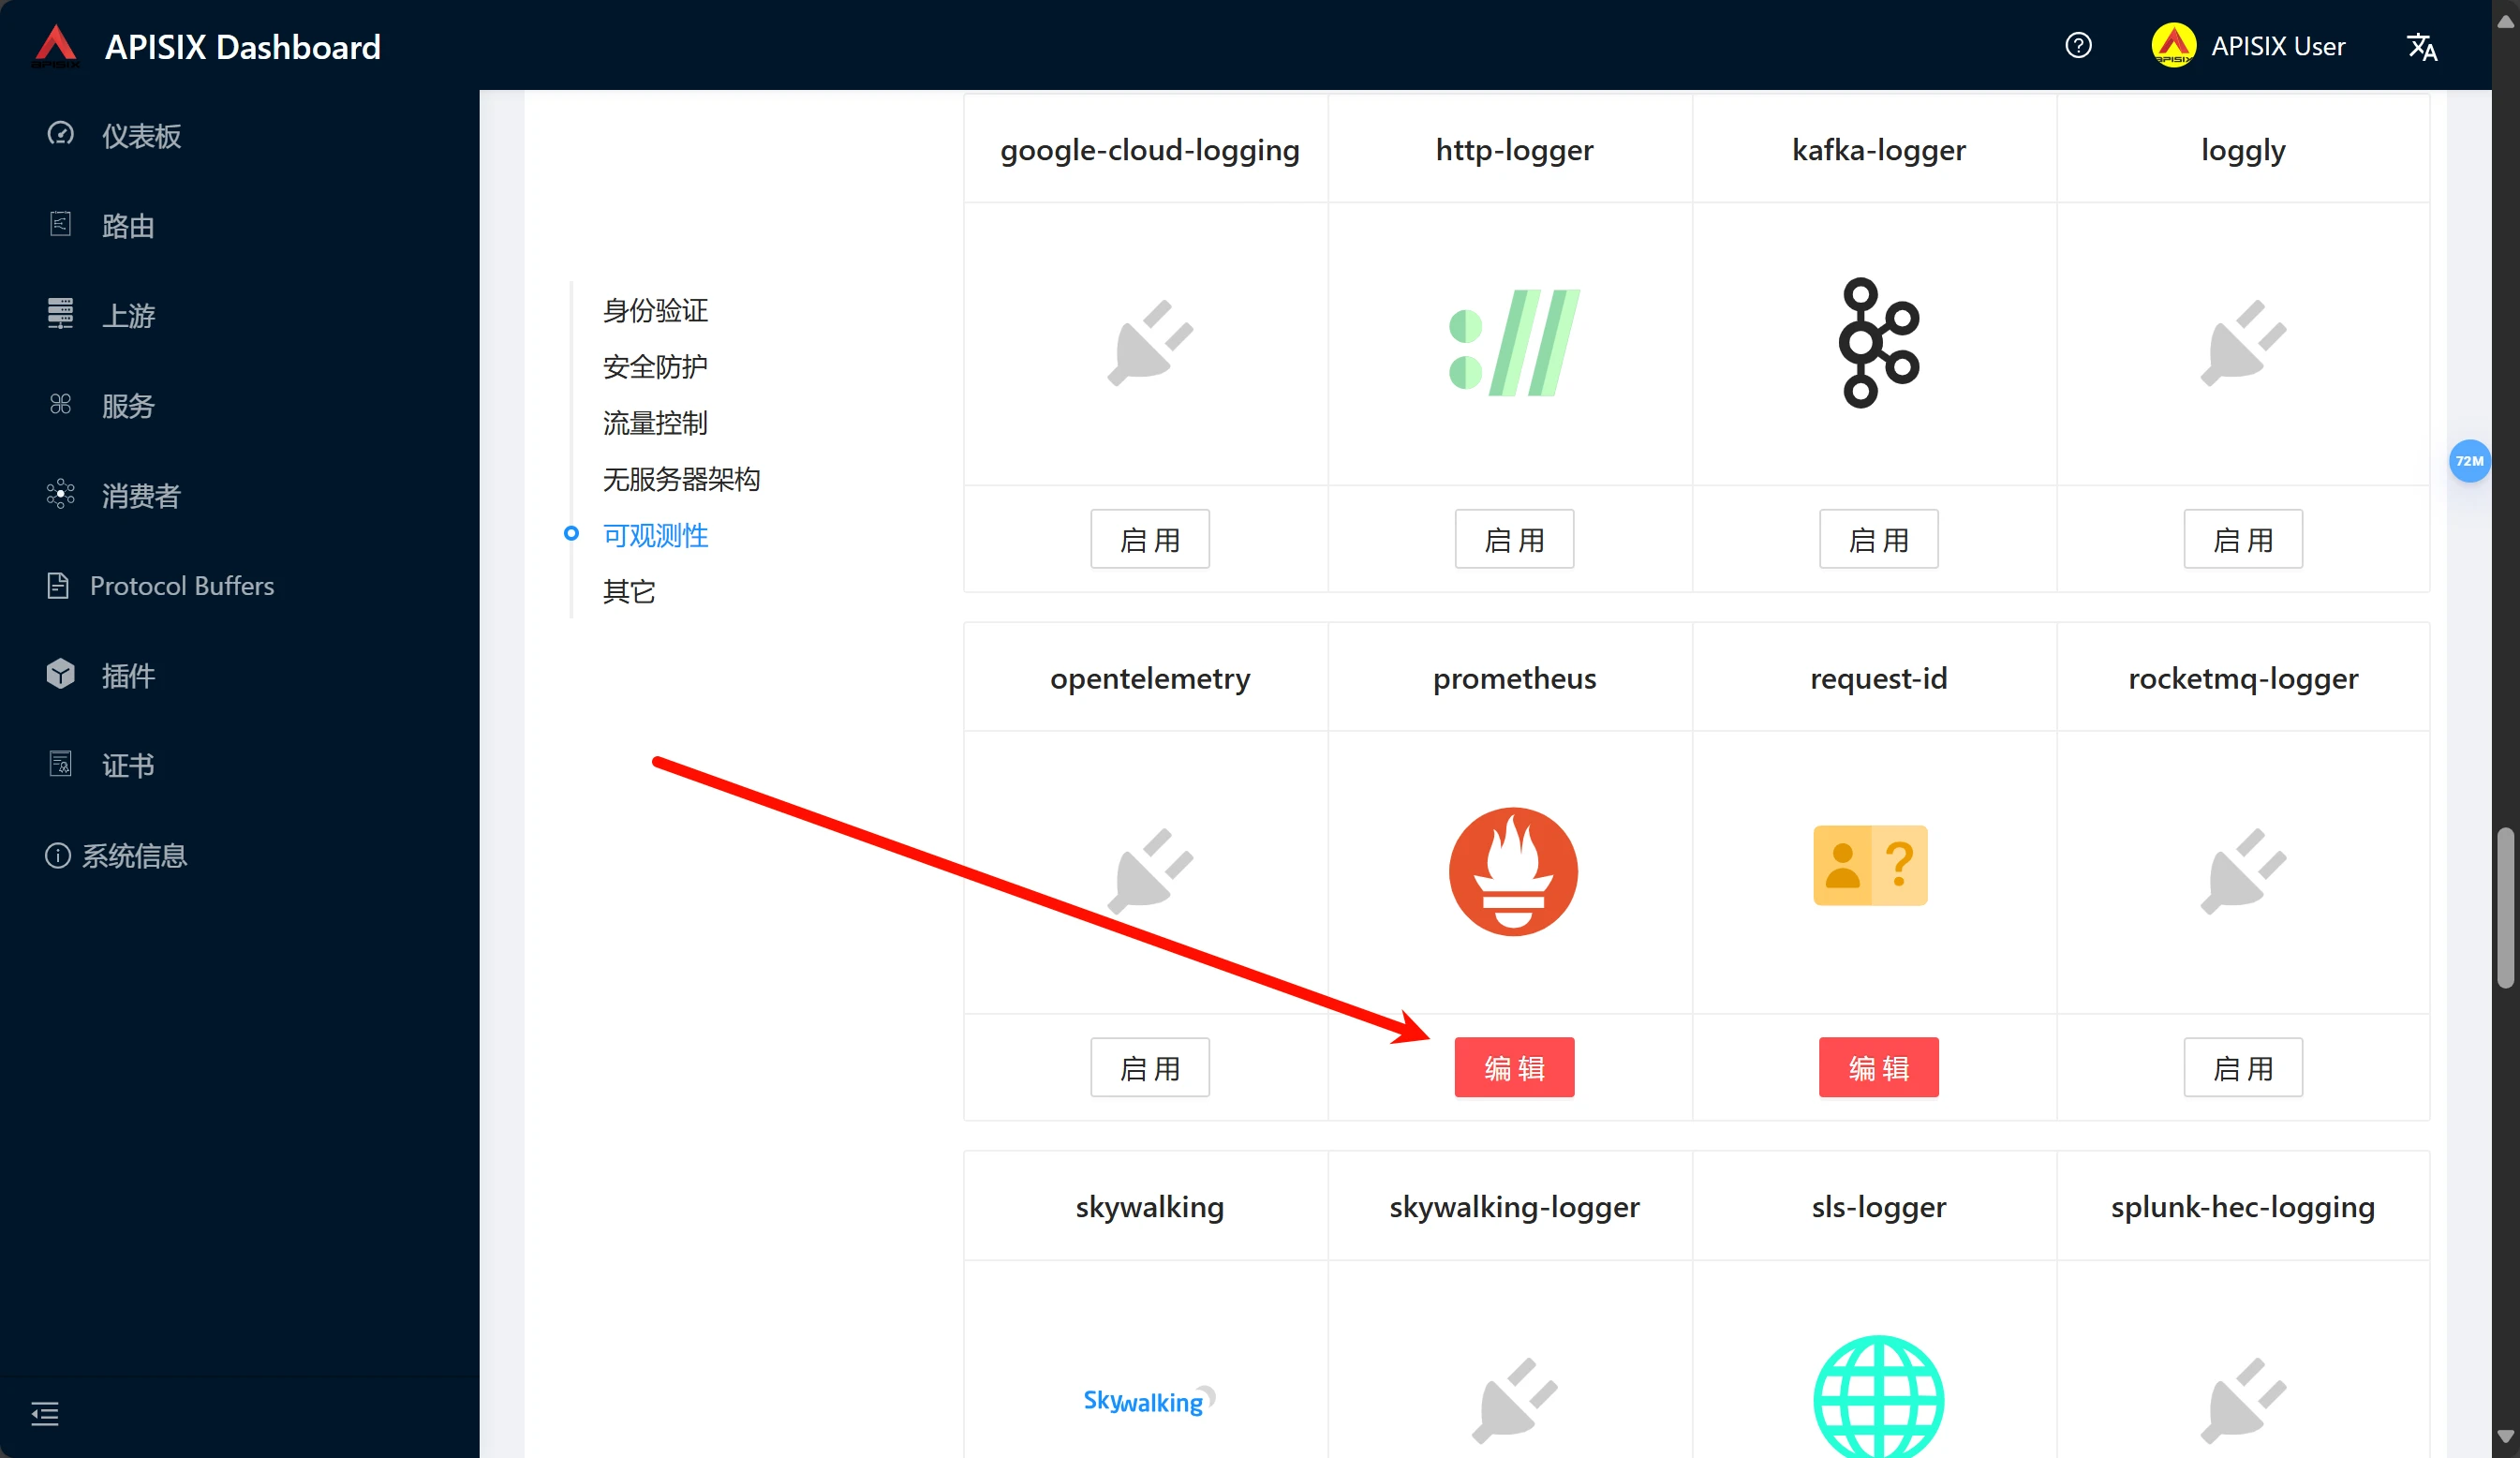
Scroll down, find the Prometheus monitoring plugin, and just enable it.
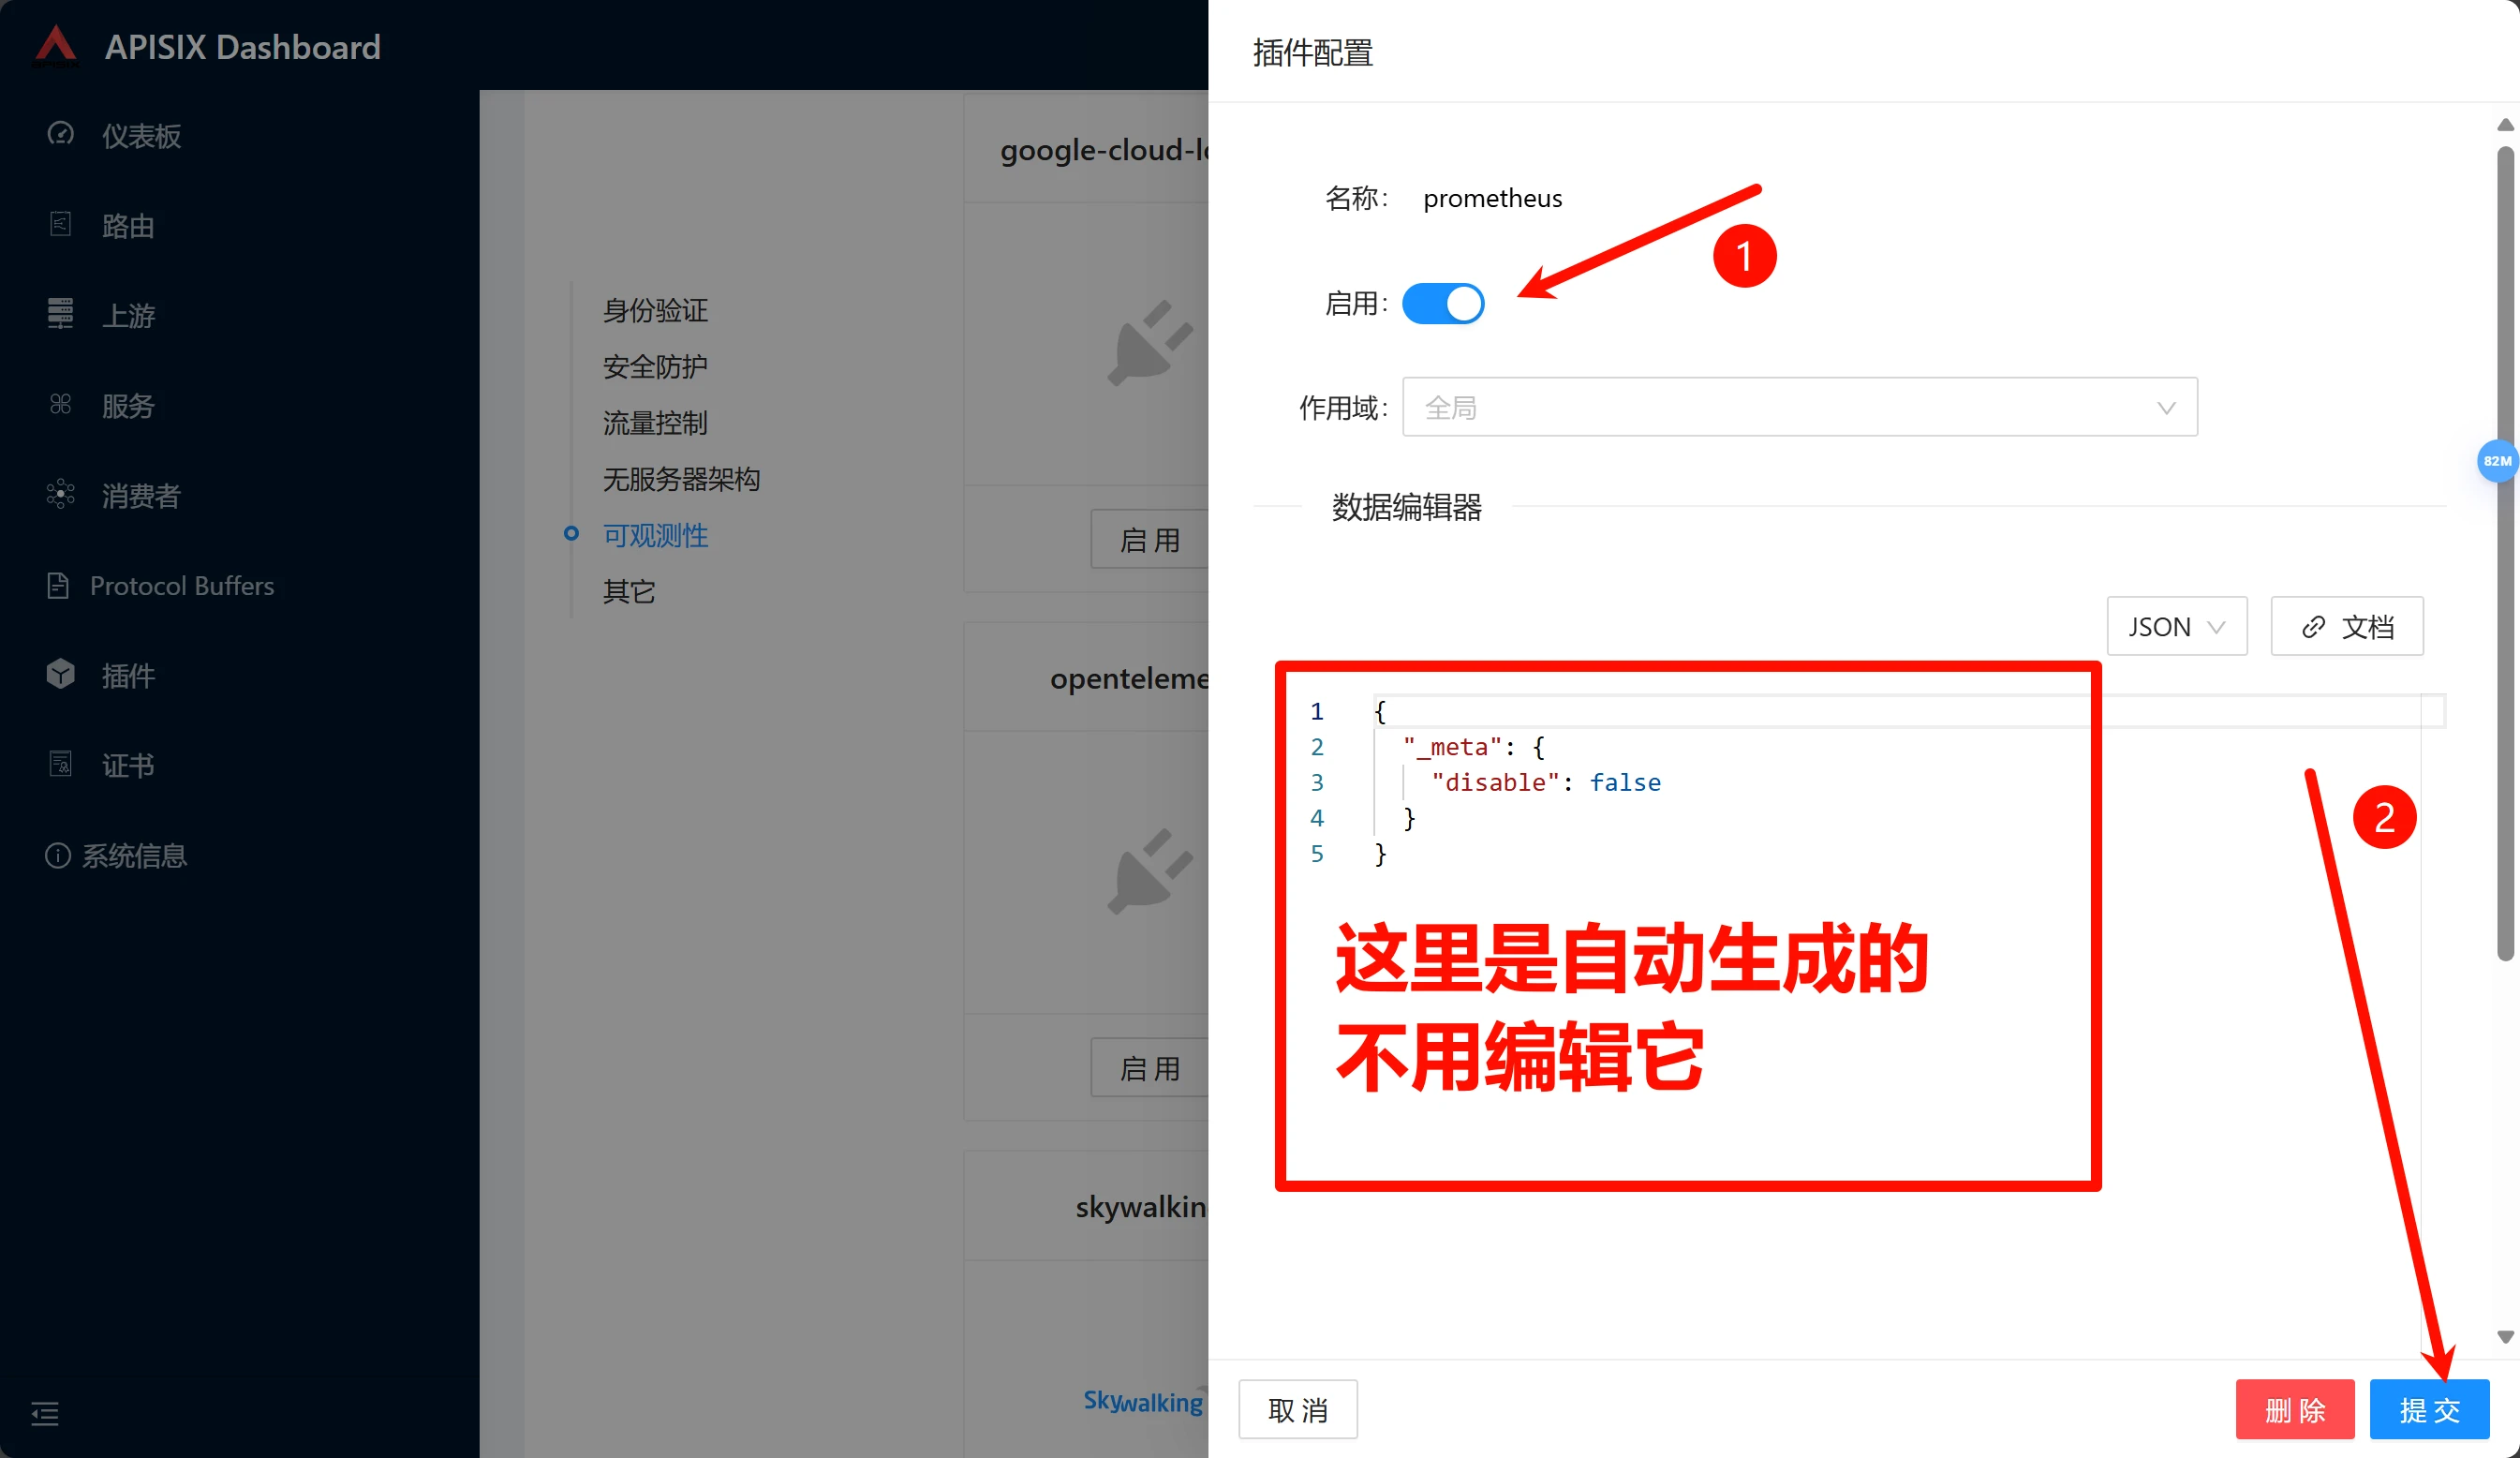
After enabling it, just submit.
Comments
Discussion
Be kind and keep the discussion friendly.
Discussion
0 comments